













官方供应商
我们作为官方授权经销商,直接提供超过200家开发厂家所发行超过1000个的产品授权给您。
查看我们的所有品牌。
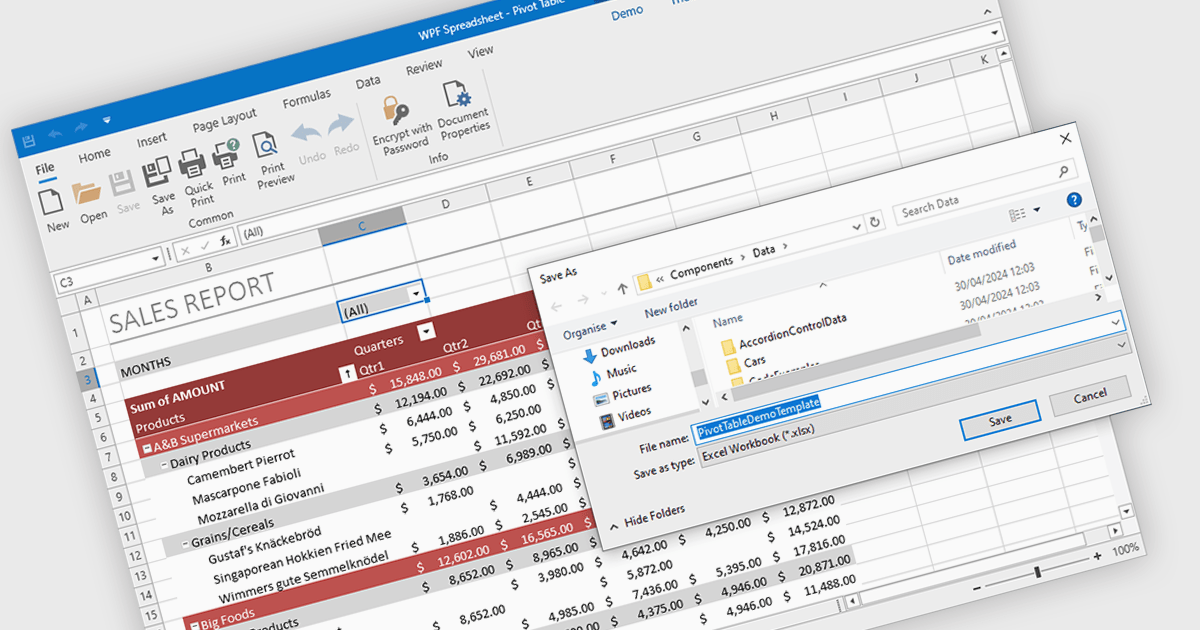
Spreadsheet components with XLSX export functionality allow developers to seamlessly save spreadsheet data and formatting from their application as a Microsoft Excel compatible file. This functionality provides significant benefits such as increased data portability for users who can then open and edit the spreadsheets in Excel, and improved collaboration as data can be easily shared and worked on across different platforms.
Several WPF spreadsheet controls offer the ability to export XLSX files including:
For an in-depth analysis of features and price, visit our WPF spreadsheet controls comparison.
Infragistics Ultimate UI for Windows Forms and Infragistics Ultimate UI for WPF are comprehensive suites of UI controls designed to streamline development and enhance the user experience of desktop applications. Boasting over 100 components, they offer a rich set of functionalities, including data visualization tools, high-performance grids, and modern UI elements that mimic the look and feel of Microsoft Office. These feature-packed libraries empower developers to craft powerful, visually appealing applications with a consistent user experience.
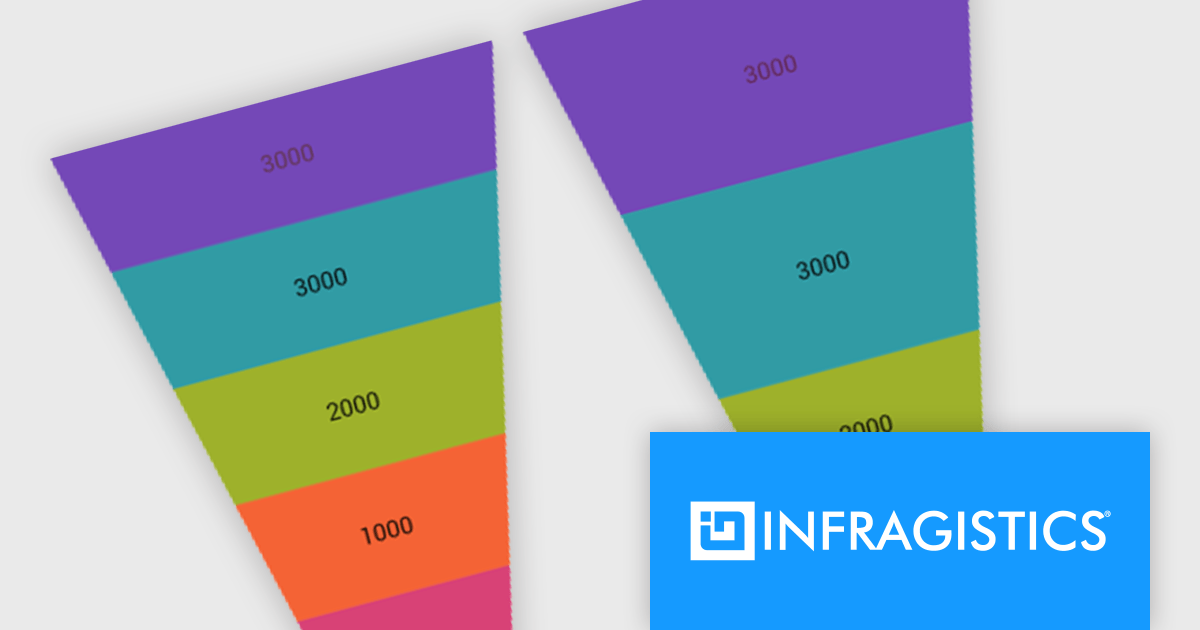
In the latest version, funnel charts can now display a special overlay to highlight specific sections. This highlighting feature allows you to compare the values of different stages in your funnel. You can also control the transparency of the overlay to emphasize the difference between the main data and the highlighted data.
To see a full list of what's new, see our release notes for Infragistics Ultimate UI for Windows Forms and Infragistics Ultimate UI for WPF.
Infragistics Ultimate UI for Windows Forms and Infragistics Ultimate UI for WPF are licensed per developer and are available as a Perpetual License with 1, 2 or 3 year support and maintenance subscription. See our Infragistics Ultimate UI for Windows Forms licensing page or Infragistics Ultimate UI for WPF licensing page for full details.
Infragistics Ultimate UI for Windows Forms is available to buy in the following products:
Infragistics Ultimate UI for WPF is available to buy in the following products:
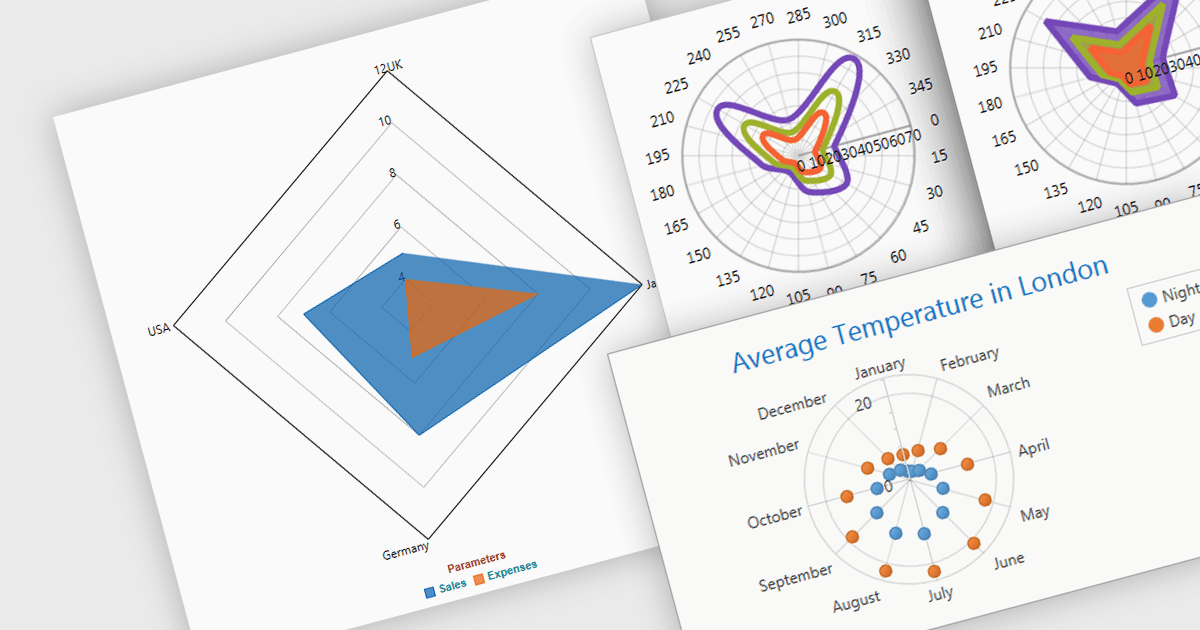
Radar and polar charts are both visualizations for displaying multiple data Radar charts specifically connect the data points to form a web-like shape, highlighting relative strengths and weaknesses across categories. Polar charts focus on the angular relationship between data points. Both are ideal for comparing sets of data with several variables, making them valuable tools in fields like performance analysis, where strengths and weaknesses across different metrics need to be understood.
Several WPF chart components support radar and polar charts, including:
For an in-depth analysis of features and price, visit our comparison of WPF chart components.
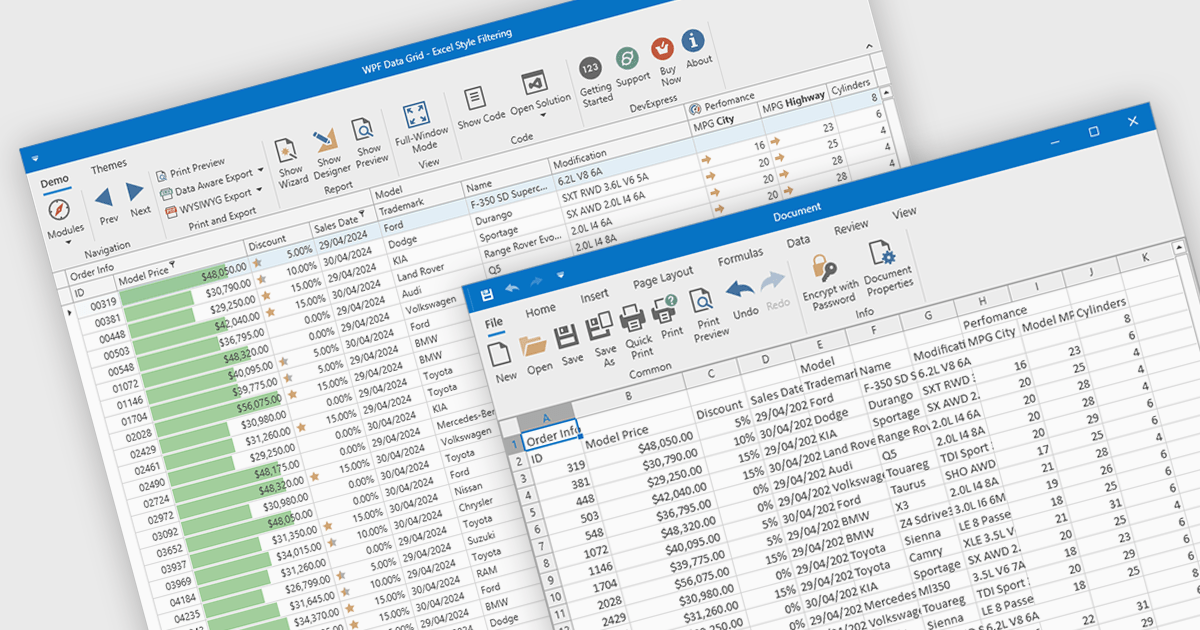
CSV export in grid components refers to the functionality that allows users to download data as a Comma-Separated Values (CSV) file. Exporting data to CSV format offers significant benefits, including compatibility with a wide range of applications, such as Microsoft Excel, Google Sheets, and other data analysis tools, facilitating easy sharing and processing. Use cases for CSV export are diverse, ranging from business analysts exporting reports for further analysis, to IT professionals extracting system data for audit and compliance purposes. Developers can leverage CSV export to provide users with a straightforward method to back up or transfer data between different systems or platforms, enhancing the utility and flexibility of applications that handle large datasets.
Several WPF grid controls offer export to CSV including:
For an in-depth analysis of features and price, visit our WPF Grid controls comparison.
Spread.NET by MESCIUS helps you create spreadsheets, grids, dashboards, and forms. It includes a powerful calculation engine with 450+ functions and the ability to import and export Microsoft Excel spreadsheets. Developers can leverage the extensive .NET spreadsheet API and powerful calculation engine to create analysis, budgeting, dashboard, data collection and management, scientific, and financial applications.
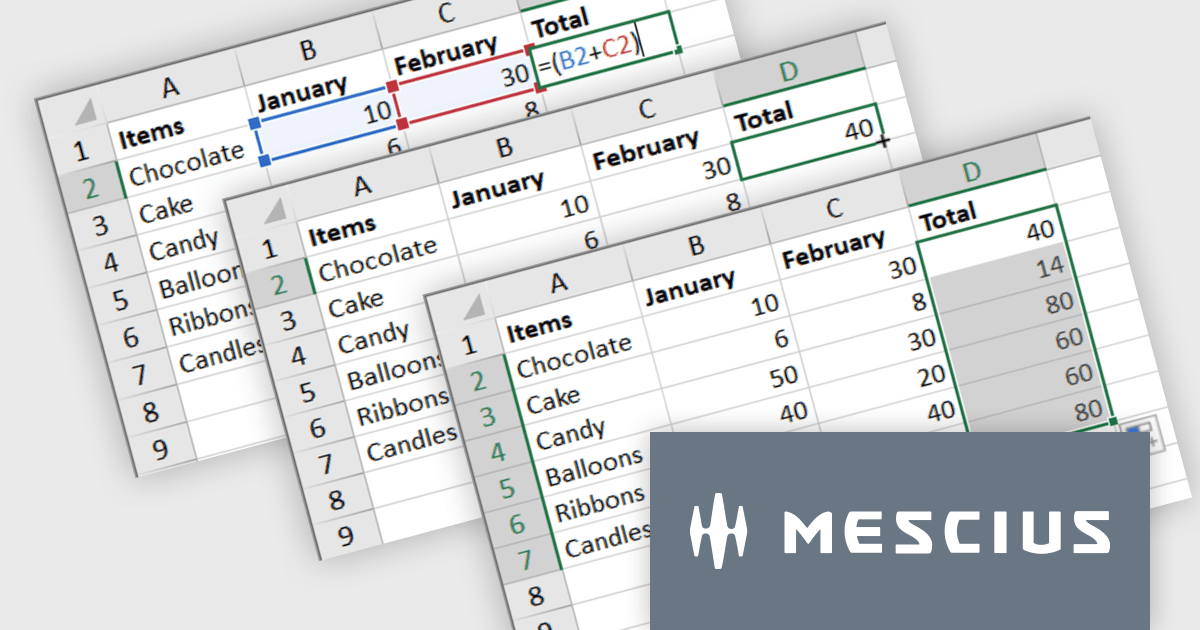
The Spread.NET v17.1 update introduces a streamlined method for extending formulas across datasets by allowing users to double-click the fill handle located at the bottom right corner of a selected cell. This action automatically replicates the formula down to the end of the data range, aligning it with the rows in adjacent columns. By simplifying the process of copying formulas, this feature enhances both efficiency and accuracy in data management tasks. It eliminates the need for manual drag-and-fill operations, reducing the time spent on repetitive tasks and minimizing the risk of inconsistencies in data entry. This improvement is particularly advantageous for users working with extensive datasets, facilitating quicker data processing and a more user-friendly experience in spreadsheet management.
To see a full list of what's new in version 17.1, see our release notes.
Spread.NET is licensed per developer and is available as a Perpetual License with a 12 month support and maintenance subscription. We can supply any Spread.NET license including new licenses, maintenance renewals, and upgrade licenses. See our Spread.NET licensing page for full details.
For more information, visit our Spread.NET product page.
联系电话: (888) 850 9911
传真: +1 770 250 6199


