


官方供应商
我们作为官方授权经销商,直接提供超过200家开发厂家所发行超过1000个的产品授权给您。
查看我们的所有品牌。
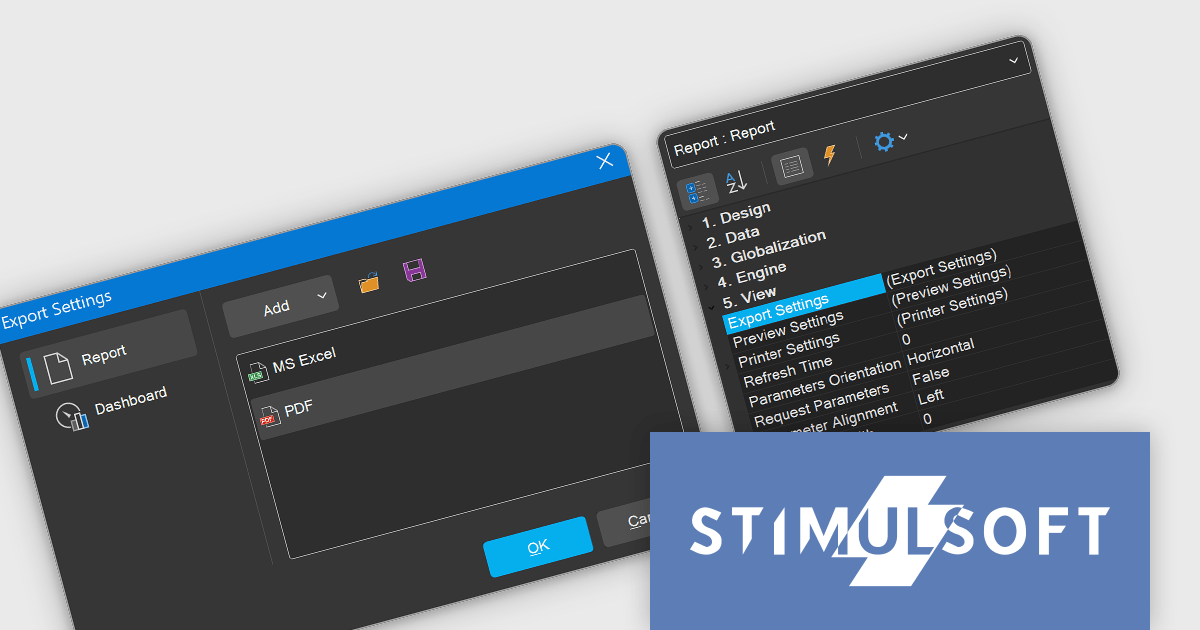
Stimulsoft Reports.NET is a reporting tool that empowers developers to design, edit, view, export, and print reports of varying complexity. It features a user-friendly report designer and an interactive viewer, allowing connection to various data sources. The generated reports can be seamlessly integrated into both Windows Forms and ASP.NET applications, with export capabilities to numerous formats for maximum flexibility.
The Stimulsoft Reports.NET 2024.4.1 release introduces a new Export Settings property, allowing export configurations to be set directly within the report template. This enhancement removes the need for separate export setup steps, ensuring consistent application of export settings each time the report is generated. By embedding export settings within the template, the report definition becomes entirely self-contained, improving portability and streamlining report management.
To see a full list of what's new in 2024.4.1, see our release notes.
Stimulsoft Reports.NET is licensed per developer and is available as a perpetual license with 1 year support and maintenance. See our Stimulsoft Reports.NET licensing page for full details.
Stimulsoft Reports.NET is available in the following products:
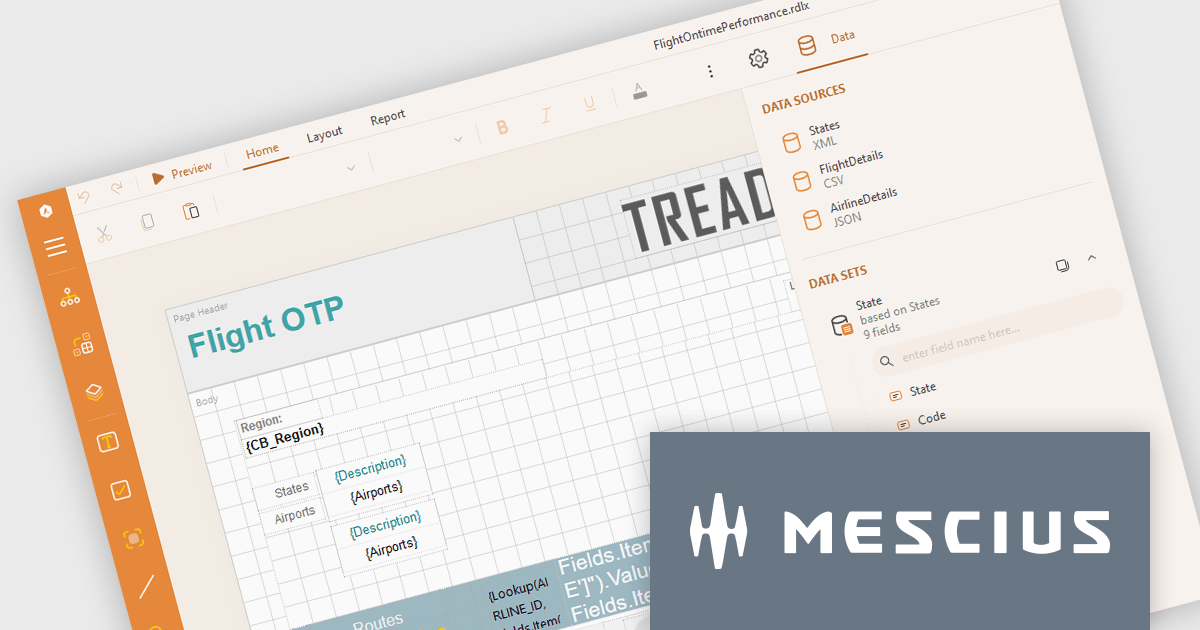
ActiveReports.NET from MESCIUS, is a comprehensive reporting solution for developers building applications in .NET. It empowers you to design and deliver visually appealing reports through user-friendly designers and a wide range of controls. ActiveReports simplifies report creation and distribution with a versatile API, rich data source connectivity, and support for multiple export formats. This translates to increased developer productivity and improved end-user experience with powerful reporting functionalities within your .NET applications.
The ActiveReports.NET v18.2 update enhances the XML Data Display in the Web Designer by introducing a tree structure for data fields, making it significantly easier to navigate and understand complex XML data. This intuitive format allows developers to quickly explore hierarchical data structures, streamlining the data binding process and reducing the effort required to interpret XML data. As a result, developers can focus more on designing reports efficiently rather than spending time deciphering the data itself, leading to a more productive and user-friendly report development experience.
To see a full list of what's new in 18.2, see our release notes.
ActiveReports.NET is licensed per developer and is available with or without a 12 month support and maintenance subscription. See our ActiveReports.NET licensing page for full details.
Learn more on our ActiveReports.NET product page.

Read-only columns in a data grid are vertically displayed fields that are not editable by users, but can still be viewed. These columns typically display information that is derived from other data or is considered static and should not be altered. By stopping users from directly modifying certain content, developers can ensure data integrity and consistency while still providing full visibility. This feature prevents accidental or intentional changes that might disrupt the system's functionality. Such restrictions streamline workflows by distinguishing between editable and non-editable data, reducing the risk of errors and improving overall system reliability.
Several WPF grid components allow you to display read-only columns, including:
For an in-depth analysis of features and price, visit our comparison of .NET WPF grid components.
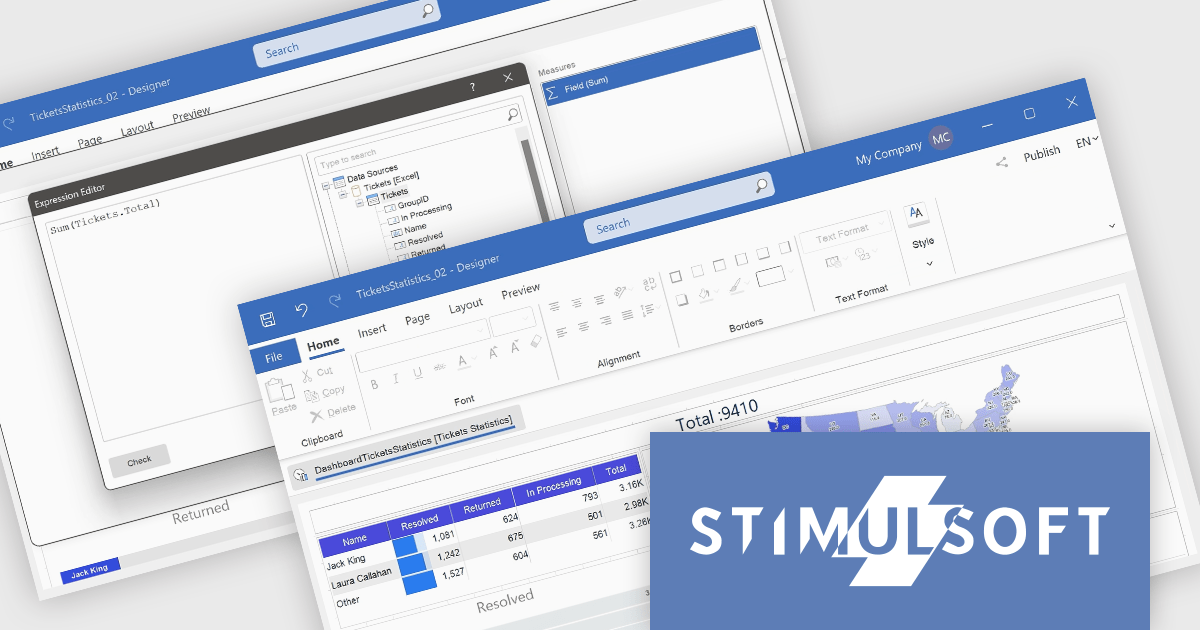
Stimulsoft Dashboards.WEB is a versatile suite of tools for crafting interactive data visualizations for web and desktop applications. It empowers developers to embed intuitive dashboards across various platforms, using the platform-specific components or a centralized cloud designer. With rich data analysis elements, extensive customization options, and pre-built templates, Stimulsoft Dashboards helps you transform complex data into clear, actionable insights for any audience.
The Stimulsoft Dashboards.WEB 2024.4.1 release adds the ability to create Measures within the Text dashboard element, which significantly enhances the flexibility and functionality of dashboards by allowing users to dynamically incorporate calculated values into text elements. This feature enables more informative and contextualized reports, as users can seamlessly display and update relevant metrics directly within the text, eliminating the need for separate data visualization components. This not only streamlines dashboard creation but also improves data accessibility and understanding for end-users.
To see a full list of what's new in 2024.4.1, see our release notes.
Stimulsoft Dashboards.WEB is licensed per developer and is available as a perpetual license with 1 year support and maintenance. See our Stimulsoft Dashboards.WEB licensing page for full details.
Stimulsoft Dashboards.WEB is available in the following products:
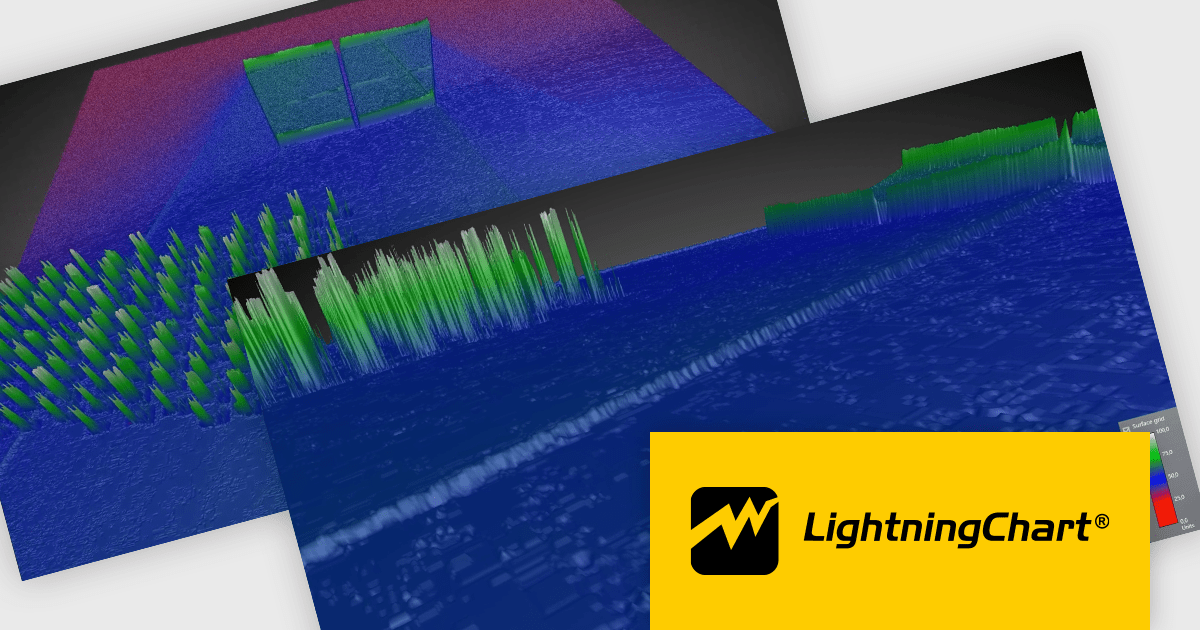
LightningChart .NET is a high-performance data visualization library designed for .NET developers working with WPF, WinForms, and UWP applications. It offers GPU-accelerated rendering for smooth real-time visualization of massive datasets, exceeding billions of data points. This library supports a wide variety of chart types, including 2D, 3D, polar, and geographic maps, along with extensive customization options for each. LightningChart .NET is a powerful tool for developers creating demanding data visualization applications requiring exceptional performance.
The LightningChart .NET v12.1.1 update delivers a substantial performance boost to 3D interactions, particularly for large surface-rendering objects such as SurfaceGridSeries3D, SurfaceMeshSeries3D, and MeshModel. This improvement allows for faster zooming, rotating, and panning, significantly enhancing the efficiency of workflows involving complex 3D models. Developers working on mid-level systems will experience at least double the performance, while high-end graphics setups can achieve up to a tenfold increase in speed. These optimizations enable smoother and more responsive interaction with large datasets, leading to more productive and seamless user experiences when working in demanding 3D environments.
To see a full list of what's new in v12.1.1, see our release notes.
LightningChart .NET is available per developer in packages for either WPF, WinForms, UWP or all 3. Each package comes as a subscription license (with 1 or 2 years of limited support), or a perpetual license (with 1 or 2 years of Standard or Premium support). Floating licenses and site licenses are available upon request. See our LightningChart .NET licensing page for full details.
Learn more on our LightningChart .NET product page.
联系电话: (888) 850 9911
传真: +1 770 250 6199


