













官方供应商
我们作为官方授权经销商,直接提供超过200家开发厂家所发行超过1000个的产品授权给您。
查看我们的所有品牌。

LightningChart JS is a high-performance JavaScript charting library optimized for real-time data visualization. Leveraging WebGL and GPU acceleration, it enables developers to create interactive, complex charts capable of handling massive datasets with high refresh rates. Ideal for applications demanding rapid data updates and smooth interactions, LightningChart JS provides a robust API for customization and integration into web-based projects.
The LightningChart JS v6.1 update introduces the Parallel Coordinate Chart, a powerful tool designed for advanced data visualization and exploration. It allows developers to work with large-scale datasets, supporting over 100,000 series and multiple axes while maintaining high performance. This chart type is optimized for real-time data input, enabling smooth updates at high stream rates. With features like value-based coloring, range-based highlighting, and interactive cursors, it provides an intuitive way to analyze and interpret complex data relationships, making it an essential addition for creating data-driven applications.
To see a full list of what's new in v6.1, see our release notes.
LightningChart JS is licensed based on method of deployment with options including SaaS Developer Licenses, Application Developer Licenses, and Publisher Developer Licenses. Each license is perpetual and includes 1 year subscription for technical support and software updates. See our LightningChart JS licensing page for full details.
Learn more on our LightningChart JS product page.
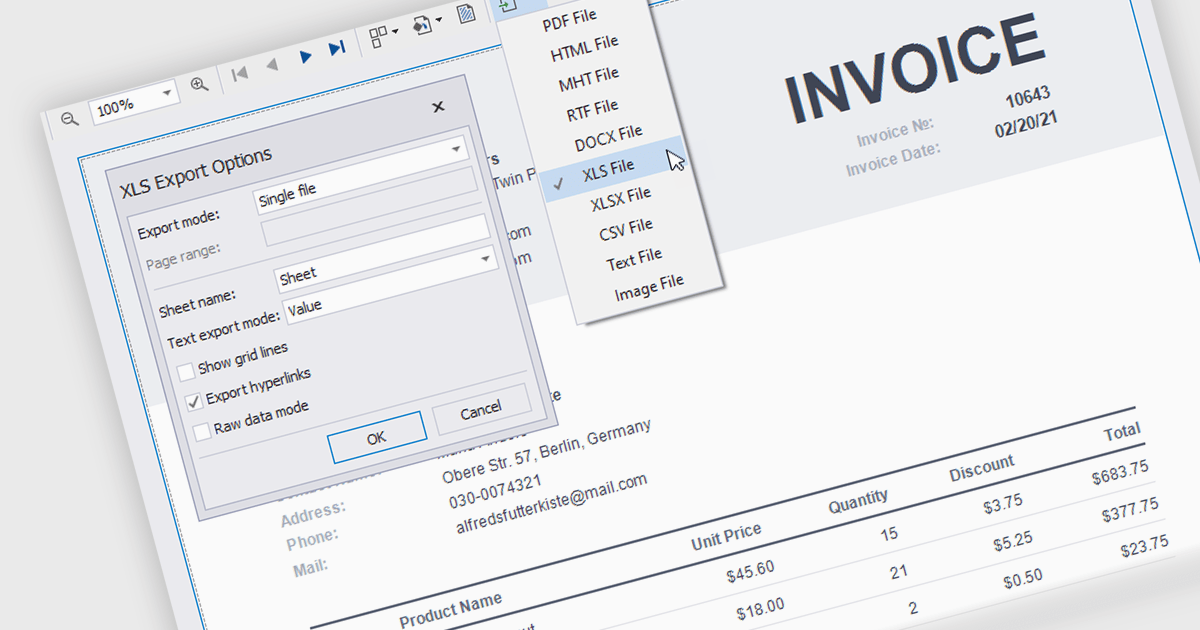
The ability to export reports to XLS/XLSX enables developers to transform report data into Microsoft Excel files in the widely-used XLS or XLSX formats. This allows easy integration of structured data with Excel's powerful data analysis and presentation tools and ensures compatibility with industry standards. It simplifies the dissemination of information by providing end-users with editable spreadsheets that preserve the layout, formatting, and accuracy of the original reports. The capability enhances user experience, streamlines workflows, and supports automated reporting solutions in enterprise and business applications.
Several .NET Reporting Controls offer exporting of reports to XLS/XLSX including:
For an in-depth analysis of features and price, visit our comparison of .NET Reporting Controls.

Blazorise is a versatile component library that empowers developers to build modern and feature-rich web applications using Blazor, a client-side web development framework from Microsoft. It offers a comprehensive collection of user interface components, including buttons, forms, charts, and navigation elements, all built with accessibility and responsiveness in mind.
The Blazorise 1.7 update adds a new PdfViewer component, providing developers with a seamless solution for rendering PDF documents directly within their applications. This new component eliminates the need for third-party libraries, offering built-in support for essential features such as zooming and navigation. By integrating this functionality natively, developers can streamline the implementation of document viewing in dashboards, reporting systems, and other applications that require efficient PDF handling. This enhancement not only simplifies development workflows but also ensures a consistent and professional user experience within Blazorise-powered applications.
To see a full list of what’s new in version 1.7, see our release notes.
Blazorise is licensed per developer and is runtime royalty free. Licenses include a 1 year subscription for updates and premium support. Professional, Enterprise, and Enterprise Plus editions are available, each offering tailored levels of support and service to meet varying business needs. See our Blazorise licensing page for full details.
For more information, visit our Blazorise product page.

PDF manipulation tools empower users to reshape and optimize documents, transforming static files into versatile assets. These capabilities cater to diverse needs, from streamlining document management to enhancing accessibility and collaboration. Whether optimizing file sizes for seamless sharing, reorganizing content to better suit a project’s structure, or combining and customizing materials for tailored communication, PDF manipulation simplifies what could otherwise be a tedious process. Such tools bridge the gap between the rigidity of fixed-format documents and the flexibility modern workflows demand, ensuring professionals can work with PDFs in ways that are both efficient and precise.
Common features include:
For an in-depth analysis of features and price, visit our .NET PDF components comparison.
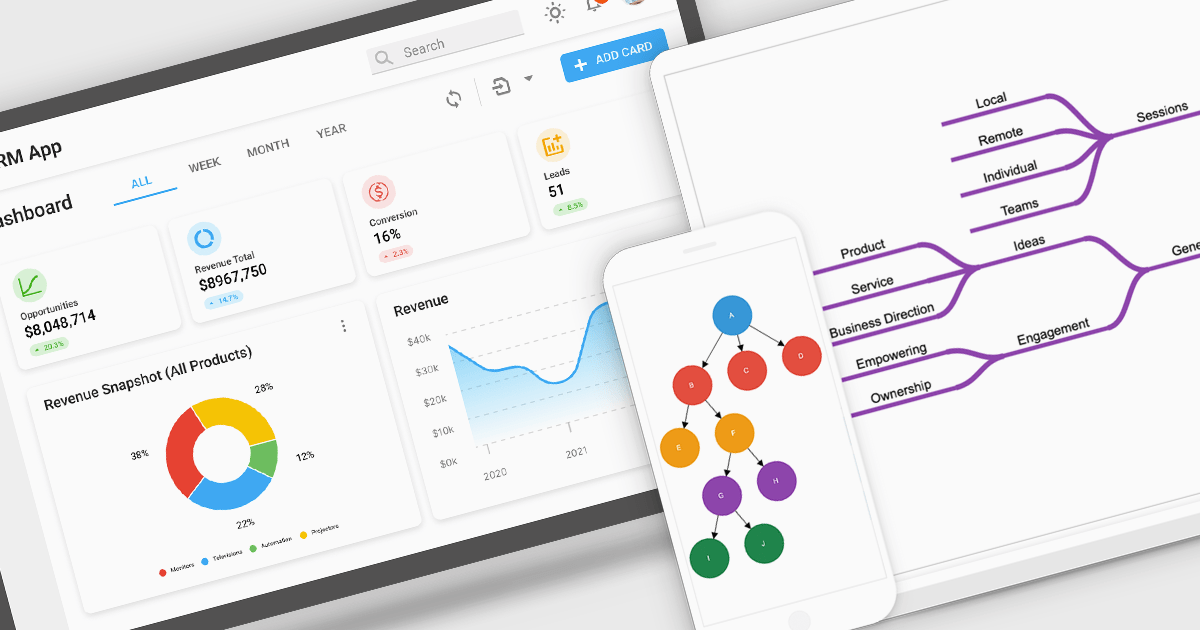
Diagrams visually represent workflows, processes, or relationships, helping users better understand and interact with complex systems. By turning abstract information into intuitive visuals, they enhance clarity and streamline team communication, making them invaluable for development and design. Diagrams are useful for prototyping, debugging, and system optimization, allowing quick identification of issues. They also foster collaboration by providing a shared visual framework for developers, designers, and stakeholders. Use cases include mapping user journeys, designing database schemas, and modeling business processes in drag-and-drop interfaces. With dynamic updates and interactivity, diagrams keep workflows accessible and actionable, driving productivity and efficiency.
Several Angular UI suites offer diagram components including:
For an in-depth analysis of features and price, visit our Angular UI suite comparison:
联系电话: (888) 850 9911
传真: +1 770 250 6199


