


官方供应商
我们作为官方授权经销商,直接提供超过200家开发厂家所发行超过1000个的产品授权给您。
查看我们的所有品牌。
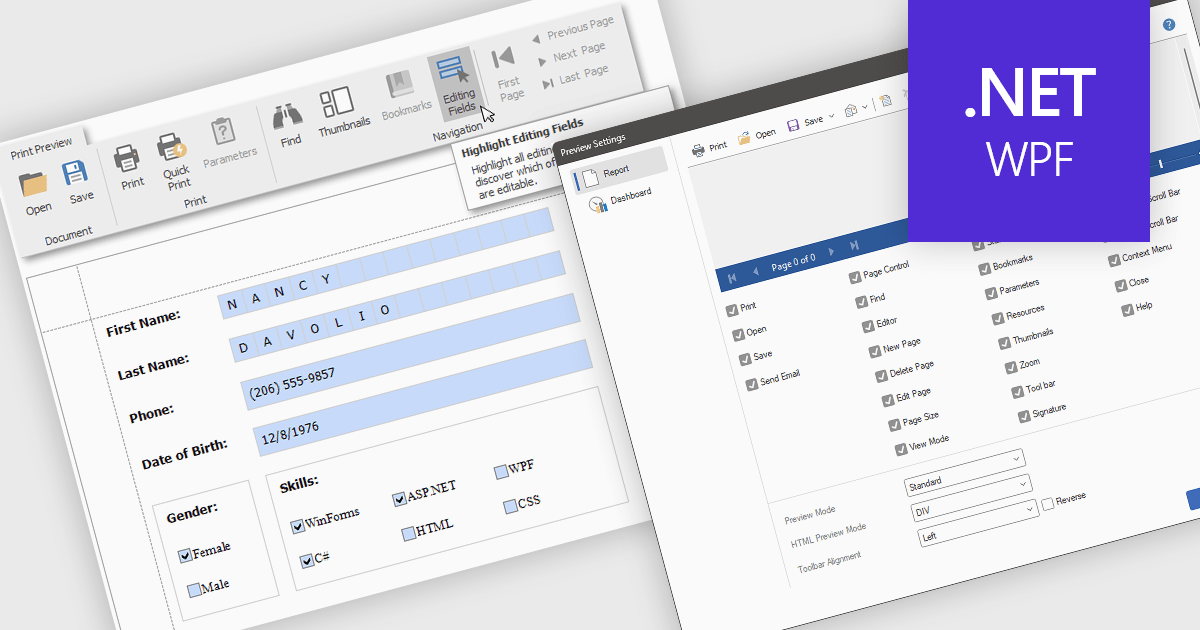
Editing reports in preview mode enables direct modification of report elements like text, charts, and layout within the review window. This approach offers benefits such as faster iteration, improved accuracy, and enhanced efficiency by eliminating the need to switch between edit and preview modes. Teams can adjust chart labels for clarity or tweak a report's layout for better presentation, instantly seeing the impact of their changes and improving the report finalization process.
Several .NET WPF Reporting Controls offer support for editing in preview including:
For an in-depth analysis of features and price, visit our comparison of .NET WPF Reporting Controls.
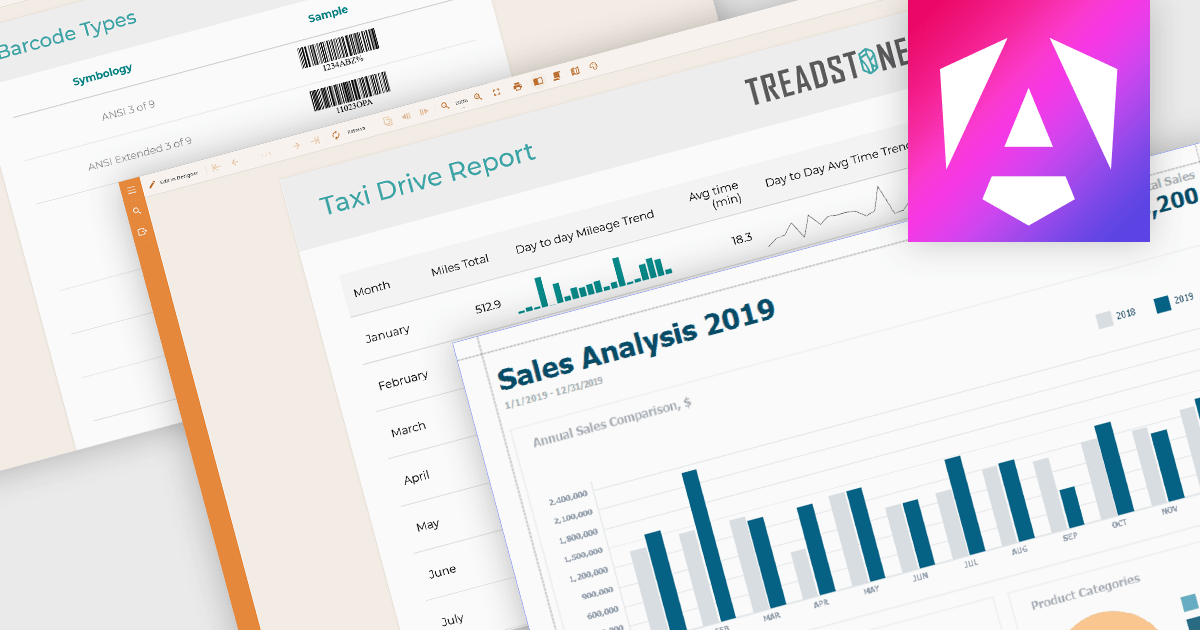
Data visualization plays a central role in reporting components by translating complex datasets into visual formats that are easier to understand and analyze. These tools help users identify patterns, monitor performance, and communicate key information at a glance. By integrating visuals directly into reports, organizations can enhance readability, support data-driven storytelling, and improve overall user engagement.
Common features include:
For an in-depth analysis of features and price, visit our Angular reporting components comparison.
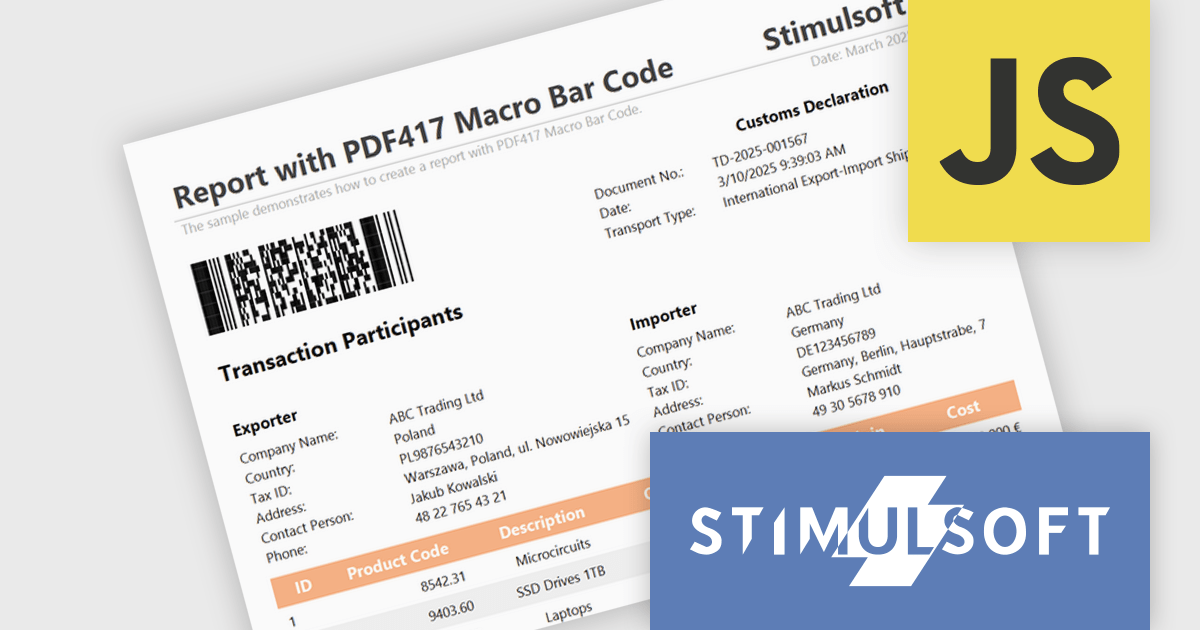
Stimulsoft Reports.JS provides a robust reporting toolkit designed specifically for JavaScript applications. This library leverages a client-side architecture, offering a pure JavaScript report engine for efficient report rendering directly within web browsers. The solution includes a user-friendly report designer for building reports with various data sources and visualizations, along with a report viewer for seamless integration and display within your JavaScript applications. This eliminates the need for server-side dependencies or browser plugins, simplifying the development process for embedding powerful reporting functionalities into your web projects.
The Stimulsoft Reports.JS 2025.2.1 update introduces support for the Macro PDF417 barcode, allowing developers to handle larger data payloads within reports. Unlike the standard PDF417 barcode, which is limited in data capacity, the Macro PDF417 format enables the encoding of large data files by splitting them into multiple linked symbols. This enhancement is particularly useful when working with high-volume or multi-page reports, providing a reliable solution for encoding structured data without compromising layout or readability.
To see a full list of what's new in 2025.2.1, see our release notes.
Stimulsoft Reports.JS is licensed per developer and is available as a Perpetual license with 1 year support and maintenance. See our Stimulsoft Reports.JS licensing page for full details.
Stimulsoft Reports.JS is available individually or as part of Stimulsoft Ultimate.
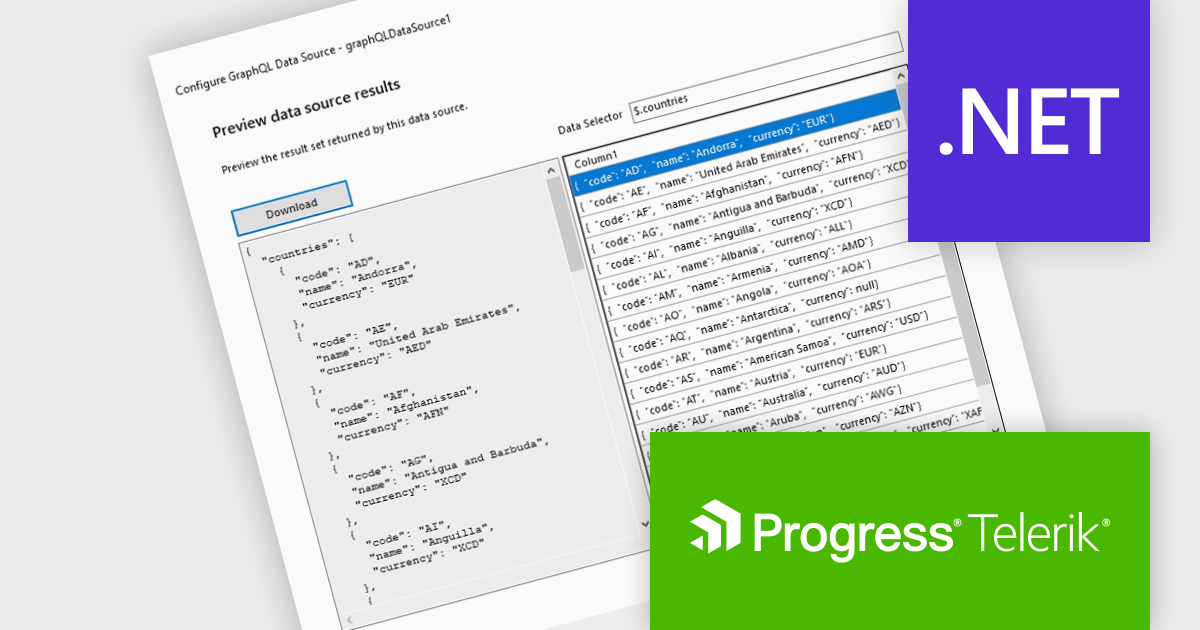
Telerik Reporting is a comprehensive and lightweight embedded reporting tool for .NET web and desktop applications. It enables developers and reporting users to create, design, and export visually appealing, interactive, and reusable reports to effectively present analytical and business data. It supports various technologies, including ASP.NET Core, Blazor, ASP.NET MVC, ASP.NET AJAX, HTML5/JS, Angular, WPF, WinForms, and WinUI.
The Telerik Reporting 2025 Q1 update introduces GraphQL native support with a dedicated GraphQLDataSource component, allowing developers to seamlessly connect reports to GraphQL APIs. This enhancement streamlines data retrieval by enabling precise queries that fetch only the necessary information, optimizing performance and reducing overhead. The Standalone Report Designer now includes an intuitive wizard that simplifies the setup process, guiding users through creating and configuring GraphQL data sources with minimal effort. By integrating GraphQL natively, Telerik Reporting enhances flexibility and efficiency, empowering developers to build dynamic, data-driven reports with greater ease and precision.
To see a full list of what's new in 2025 Q1 (19.0.25.211), see our release notes.
Telerik Reporting is licensed per developer and is available as a perpetual license with a one year support subscription, which is offered in three tiers: Lite, Priority or Ultimate. See our Telerik Reporting licensing page for full details.
Telerik Reporting is available to buy in the following products:
Advanced layout and formatting features are essential for producing professional, polished reports that align with both technical and business requirements. These capabilities enhance the structure and presentation of report content, supporting better readability, navigation, and customization. Whether delivering print-ready documents or dynamic digital reports, advanced formatting tools ensure consistency and flexibility in how data and visual elements are displayed.
Common features include:
For an in-depth analysis of features and price, visit our Blazor Reporting components comparison.
联系电话: (888) 850 9911
传真: +1 770 250 6199


