


官方供应商
我们作为官方授权经销商,直接提供超过200家开发厂家所发行超过1000个的产品授权给您。
查看我们的所有品牌。

DevExpress VCL Subscription + is an extended version of the standard DevExpress VCL suite, designed for Delphi and C++Builder developers who need both native Windows components and modern web-based tools. In addition to the full set of high-performance VCL UI controls, such as grids, charts, and editors, it includes web technologies like JavaScript, ASP.NET Core and Blazor UI libraries. This allows developers to integrate advanced web-based features directly into their VCL desktop applications using technologies like WebView, enabling interaction between traditional VCL apps and modern web interfaces and making it easier to build hybrid solutions that combine the strengths of both environments.
The DevExpress VCL Subscription + 25.2 update adds a new VCL Reporting control (ExpressReports Suite) for building and displaying reports in native Windows applications. It is based on the DevExpress JavaScript Report Designer and Viewer, with AI features to support report generation and editing. The reporting interface runs inside a desktop app using WebView and ASP.NET Core. All required .NET and JavaScript components are included in a single executable file, which simplifies installation and removes the need for separate runtime dependencies.
To see a full list of what's new in 25.2, see our release notes.
DevExpress VCL Subscription + is licensed per developer and is available as a Perpetual License with a 12 month support and maintenance subscription. See our DevExpress VCL Subscription + licensing page for full details.
For more information, visit our DevExpress VCL Subscription + product page.
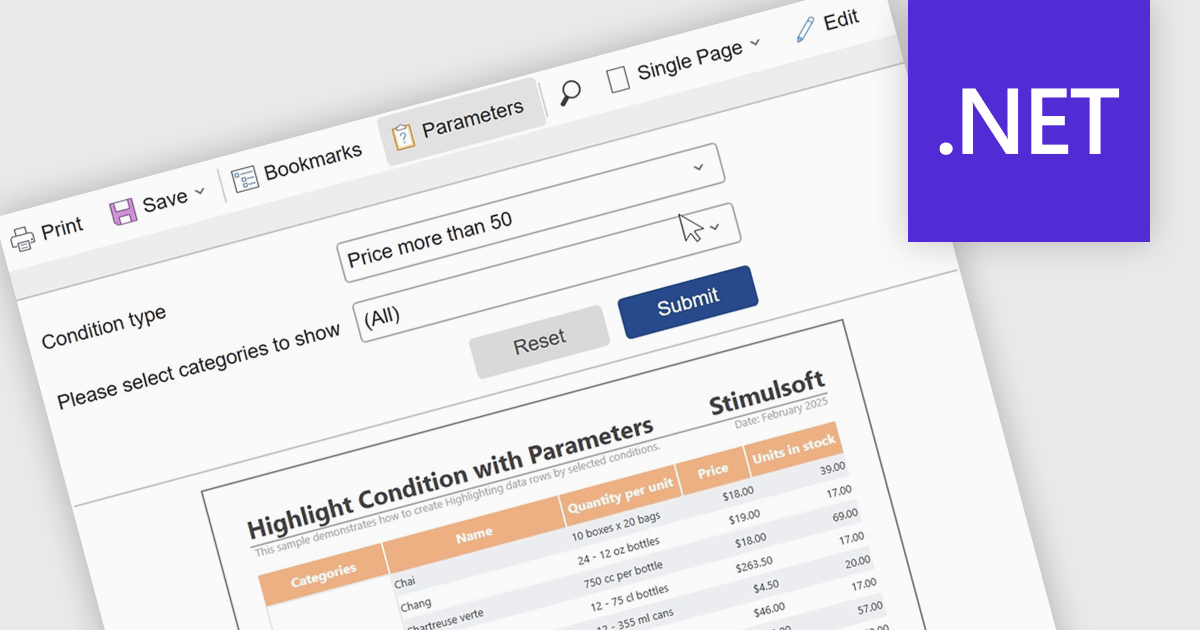
Report parameters allow users to customize and control how data is displayed by filtering results or supplying specific values at runtime. This enables more personalized, relevant reporting without the need to create multiple versions of the same report. By using parameters, organizations can improve data accuracy, improve report management, and help users to explore insights independently. Common use cases include filtering reports by date range, region, department, or product, setting thresholds or targets for performance analysis, and dynamically updating dashboards based on user-selected criteria.
Several .NET reporting components include support for parameters:
For an in-depth analysis of features and price, visit our comparison of .NET reporting controls.
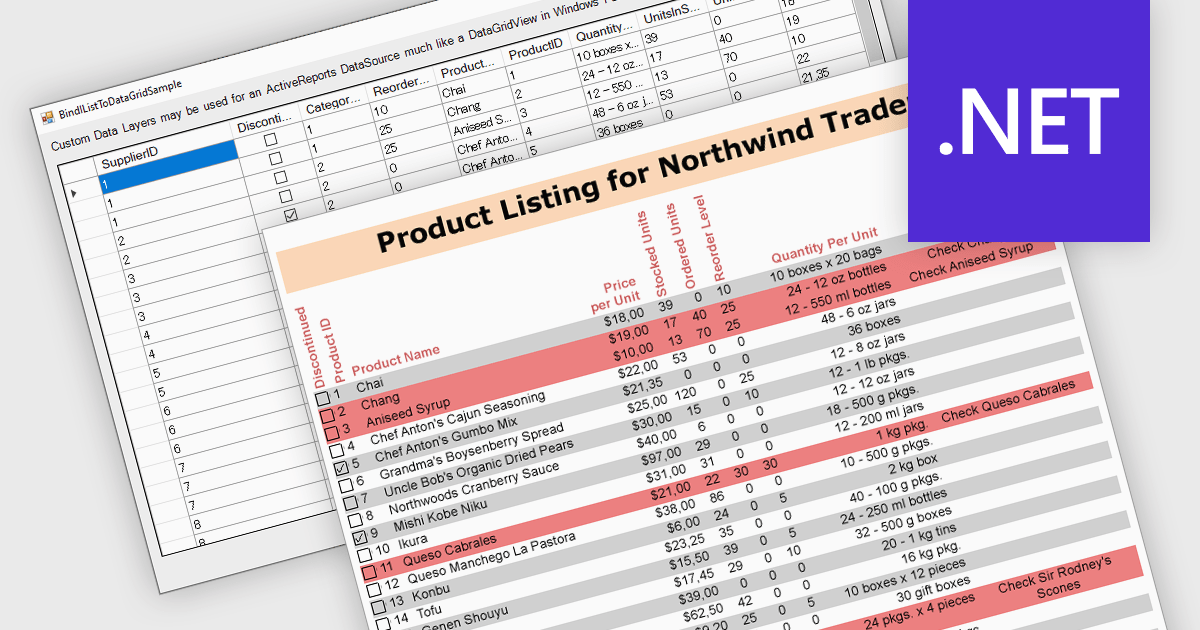
IList data source support in .NET Reporting components allows developers to bind reports directly to in-memory collections that implement the IList interface, such as generic lists or arrays. This capability offers flexibility for working with dynamically generated data or data not stored in a traditional database, making it easier to integrate with object-oriented models. It reduces the need for intermediary storage, supports runtime data manipulation, and is particularly effective in applications where data is constructed or retrieved at runtime through APIs rather than direct database access.
Several .NET Reporting controls offer IList data connectivity including:
For an in-depth analysis of features and price, visit our comparison of .NET Reporting controls.
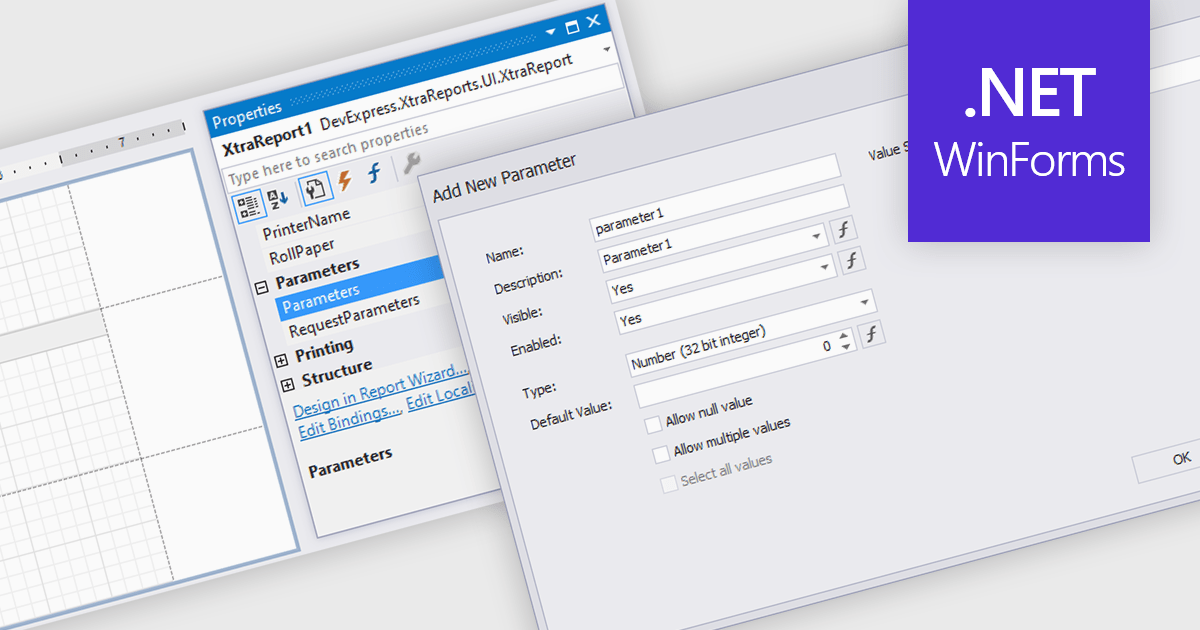
Dialog forms for parameters in reporting provide a structured and user friendly way to collect the inputs needed for accurate, relevant reports. Instead of relying on manual entry or remembered criteria, users are guided through fields that ensure consistent and valid information. This improves report quality and reduces errors in scenarios such as choosing date ranges, product categories, regions, or departments. By centralizing parameter entry in a clean interface, dialog forms let users focus on interpreting results rather than managing input details.
Several .NET WinForms reporting components allow you to create dialog forms for parameters, including:
For an in-depth analysis of features and price, visit our comparison of .NET WinForms reporting components.
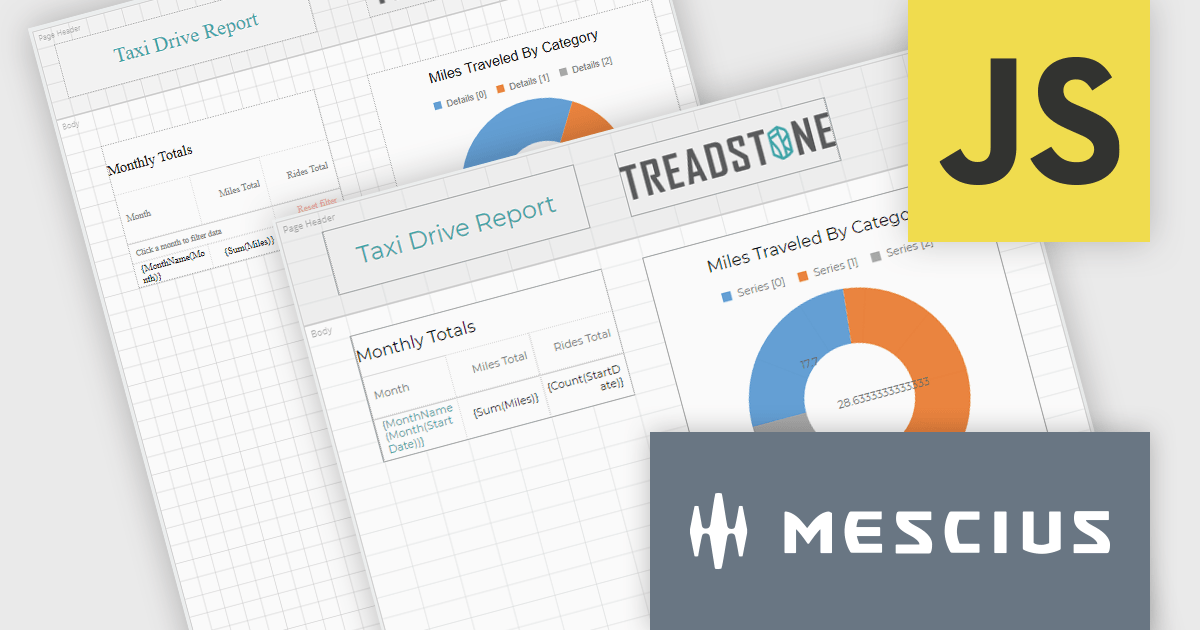
ActiveReportsJS by MESCIUS is a JavaScript reporting toolkit that allows developers to design and embed interactive reports within web applications. It includes a standalone report designer for building reports visually and a JavaScript report viewer component that integrates with web frameworks such as React or vanilla JavaScript. The toolkit supports a range of data visualization options and export formats, helping developers deliver rich, interactive reporting capabilities in the browser.
The ActiveReportsJS v6.0 update introduces a new cell-based layout mode that provides precise control over the alignment and structure of report elements using a grid of cells. This layout mirrors the structure of spreadsheets, making it particularly effective for generating reports intended for export to Microsoft Excel. It helps minimize layout inconsistencies and fragmented cells, ensuring a clean and predictable structure for exported files. Developers benefit from a more consistent and data-oriented layout approach, especially in scenarios where structural accuracy is critical.
To see a full list of what's new in 6.0, see our release notes.
ActiveReportsJS is licensed on an annual subscription or perpetual basis and is available as a Single Deployment License for non-commercial use, and as a Single Domain License or Unlimited Domain License for commercial and/or SaaS use. See our ActiveReportsJS licensing page for full details.
Learn more on our ActiveReportsJS product page.
联系电话: (888) 850 9911
传真: +1 770 250 6199


