













官方供应商
我们作为官方授权经销商,直接提供超过200家开发厂家所发行超过1000个的产品授权给您。
查看我们的所有品牌。
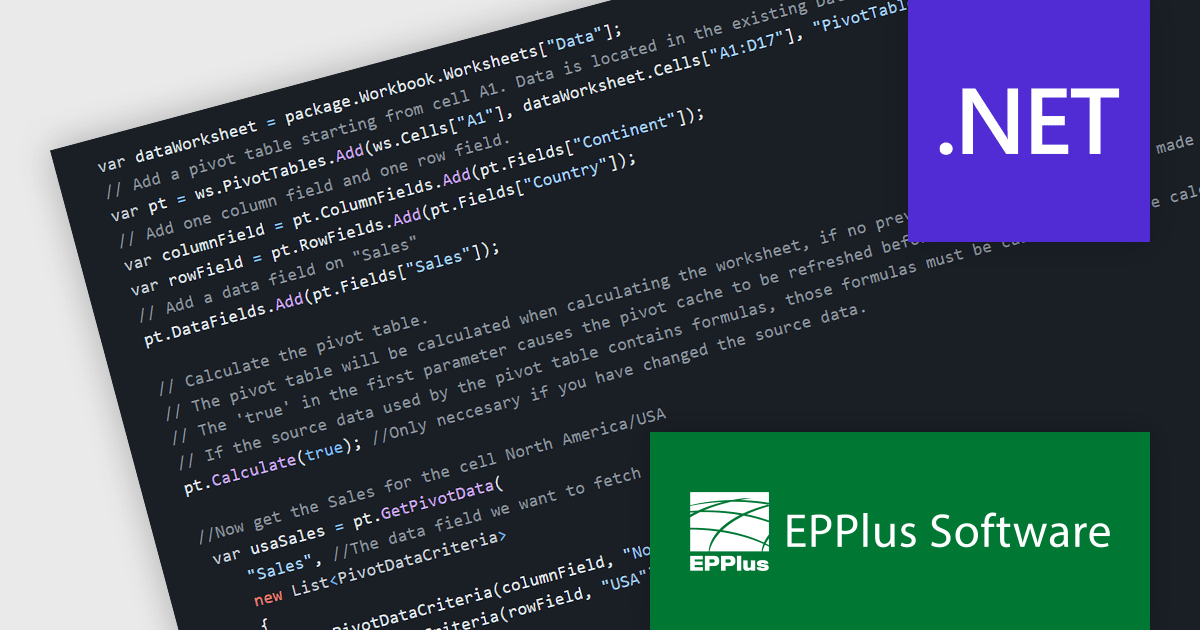
EPPlus is a powerful and versatile .NET library for managing and manipulating Microsoft Excel files using the Office Open XML (OOXML) format. It is a lightweight and efficient library that is easy to use and can be integrated into a wide range of applications. It allows developers to create, read and modify spreadsheets without dependencies on any other library. Features include pivot tables, styling, VBA/Form controls, conditional formatting, charts, tables, formula calculation, data validation, pictures/shapes, and more.
The EPPlus v7.2.0 update adds support for calculating and fetching data from pivot tables, allowing .NET developers to enhance the data analysis capabilities of their applications. This feature allows developers to dynamically summarize, analyze, and present large datasets by creating and manipulating pivot tables programmatically. It includes the ability to define calculations (sum, average, etc.) for rows and columns, format values as percentages or differences, and apply various filters (captions, numbers, dates, etc.) and sorting options. This streamlines data analysis workflows and fosters greater control over the final spreadsheet output, empowering developers to deliver more powerful data-driven solutions.
To see a full list of what's new in v7.2.0, see our release notes.
EPPlus is licensed per developer and is available as both perpetual licenses and subscription based licenses with periods of 1 year and 2 years, which include support and upgrades. See our EPPlus licensing page for full details.
For more information, see our EPPlus product page.
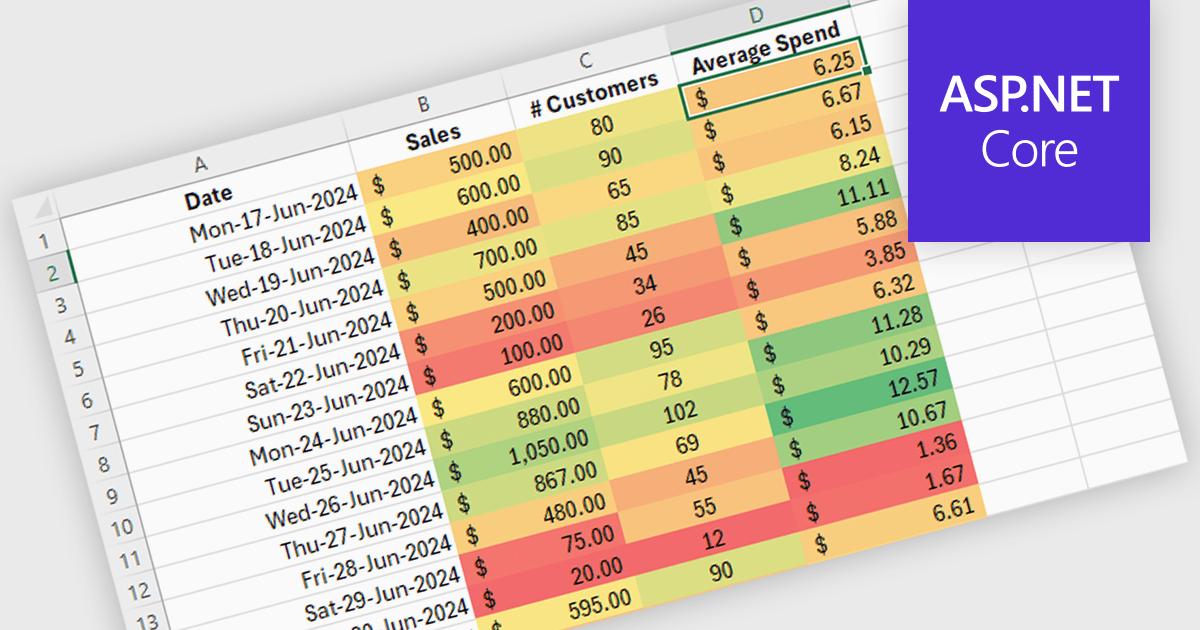
Conditional formatting in a spreadsheet component allows you to dynamically alter the visual appearance of cells based on predefined rules. This functionality enhances data readability by highlighting specific values or trends within your spreadsheet. By visually differentiating critical information, conditional formatting empowers developers to create more user-friendly and informative data presentations within their ASP.NET applications.
Several ASP.NET Core Assembly Spreadsheet Controls offer Conditional Formatting including:
For an in-depth analysis of features and price, visit our comparison of ASP.NET Core Assembly Spreadsheet Controls.
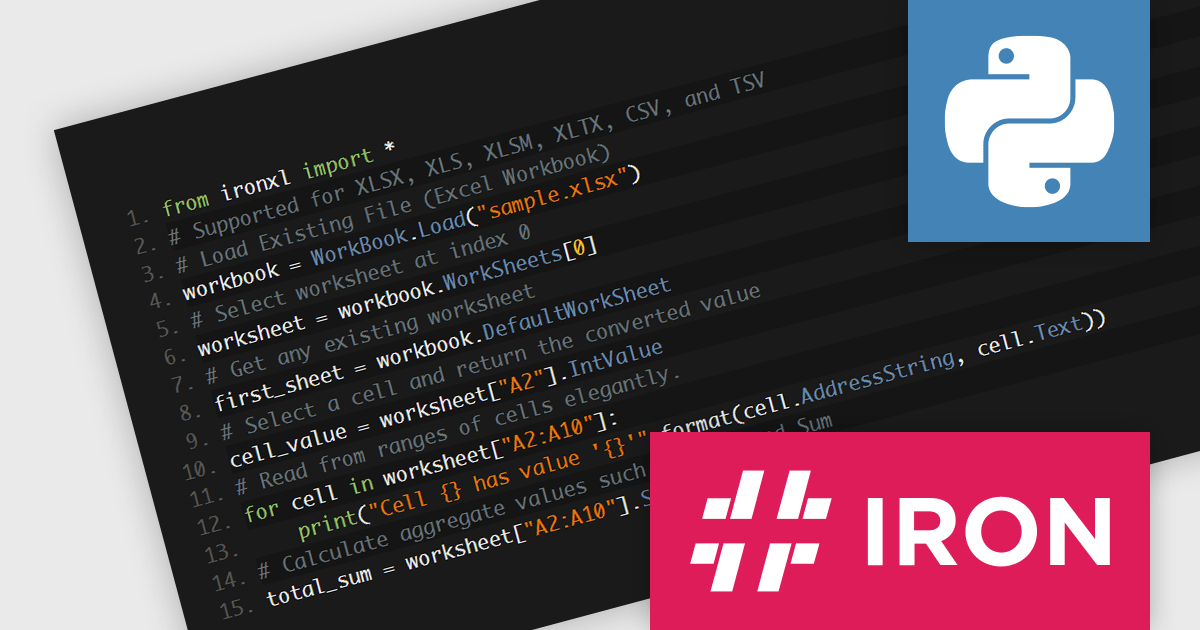
IronXL for Python via .NET by Iron Software is a Python Excel library designed to enable Python developers to manipulate, read and generate Microsoft Excel files easily by leveraging the .NET framework. It allows them to integrate Excel functionality into Python applications without requiring Microsoft Office or Excel Interop to be installed on the server or client machines. This standalone solution provides a comprehensive API for reading, creating, and editing Excel files (XLS, XLSX, XLSM, CSV, TSV, etc.) directly from Python code.
IronXL offers a compelling alternative for developers seeking an efficient and versatile solution for spreadsheet manipulation in Python environments. It facilitates the automation of report generation, data analysis, and financial modeling, all within a familiar Excel format but executed through Python scripts. It simplifies complex tasks like data import/export, formatting control, and chart generation, making it ideal for automating spreadsheet-related workflows across various industries, from data analysis and reporting to financial modeling and content generation. The use cases for IronXL span various industries including finance, research, education, and healthcare, where users need to merge, split, and export data while maintaining the integrity and formatting of their spreadsheets.
IronXL for Python via .NET is licensed based on the number of developers, organization locations and projects, and is available as a perpetual license with one free year of product updates and support services. See our IronXL for Python via .NET licensing page for full details.
For more information, see our IronXL for Python via .NET product page.
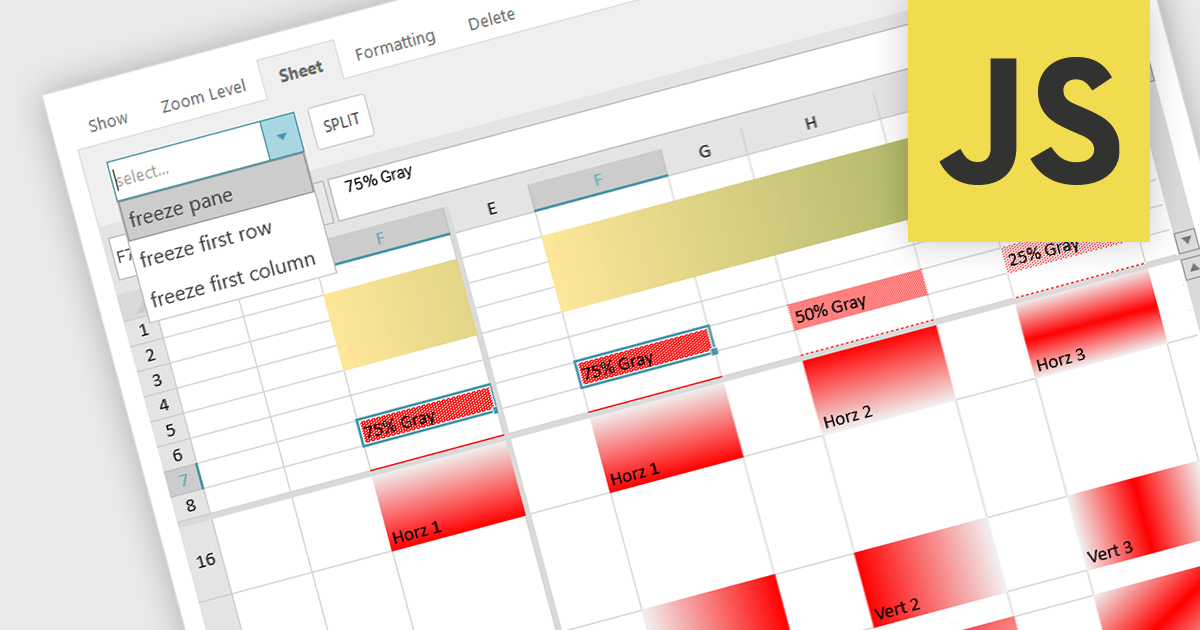
Spreadsheet controls with freeze pane support enable developers to lock specific rows or columns in place while allowing the rest of the data to scroll freely. This feature enhances the user experience by keeping headers or key reference data visible at all times, thus improving navigation and readability in large datasets. It is particularly beneficial for applications where users need to compare data across extensive spreadsheets, ensuring that critical information remains accessible without disrupting the workflow. This functionality contributes to a more efficient and user-friendly interface, reducing the cognitive load on users and facilitating better data analysis.
Several JavaScript spreadsheet controls offer freeze pane support including:
For an in-depth analysis of features and price, visit our comparison of Compare JavaScript Spreadsheet Controls.
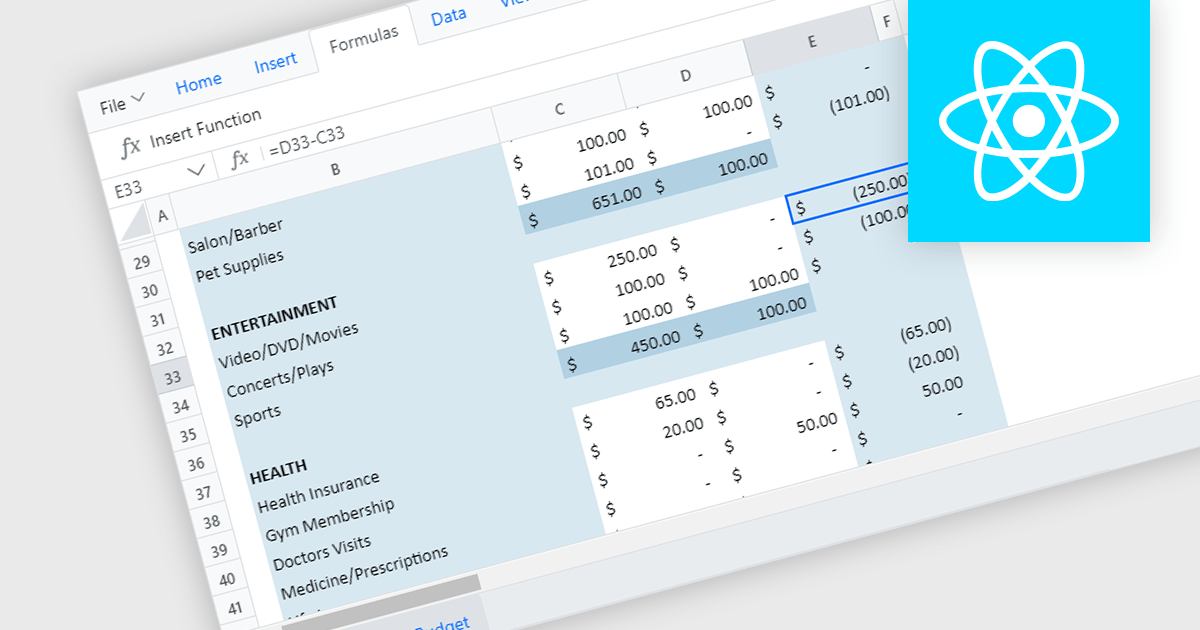
React spreadsheet controls with formula and function capabilities bring the power of spreadsheets to modern web applications. These components allow users to enter data, manipulate it using built-in formulas (like SUM or AVERAGE) or custom functions, and see the results dynamically update within the web interface. This empowers developers to create interactive data analysis tools, financial calculators, or even planning dashboards directly within their React applications.
Several React spreadsheet controls offer formula and function support including:
For an in-depth analysis of features and price, visit our React spreadsheet controls comparison.
联系电话: (888) 850 9911
传真: +1 770 250 6199


