


官方供应商
我们作为官方授权经销商,直接提供超过200家开发厂家所发行超过1000个的产品授权给您。
查看我们的所有品牌。

ComponentSource and Redgate Software have partnered since 2005 to deliver world-class database development and management tools to software teams and IT professionals around the world. This long-standing collaboration focuses on providing tools for database version control, deployment automation, performance monitoring, and data comparison. For over two decades, the partnership has been driven by a shared commitment to helping organizations streamline database workflows, reduce risk, and maintain control over complex data environments.
Redgate Software creates powerful and efficient software to help data professionals get the most value out of any database, anywhere, through the provision of globally respected database management tools. Used by more than 200,000 people worldwide, including 92% of the Fortune 100, Redgate Software solutions ensure database integrity, compliance, and performance. One of Redgate Software's offerings is SQL Toolbelt Essentials, a comprehensive suite that includes tools such as SQL Compare, SQL Prompt, and SQL Data Compare Pro. Designed to support everything from version control and deployment automation to performance diagnostics, SQL Toolbelt Essentials equips development teams and DBAs with everything they need to deliver high-quality database solutions, faster and more reliably.
Over the past two decades, the partnership between ComponentSource and Redgate Software has helped thousands of organizations streamline their database development and management processes through access to trusted, high-quality tools. As a consistently strong performer in the ComponentSource catalog, Redgate Software remains a valued partner, with a shared commitment to supporting data professionals and advancing excellence in SQL Server development and administration for the years ahead.
Learn more about Redgate Software.
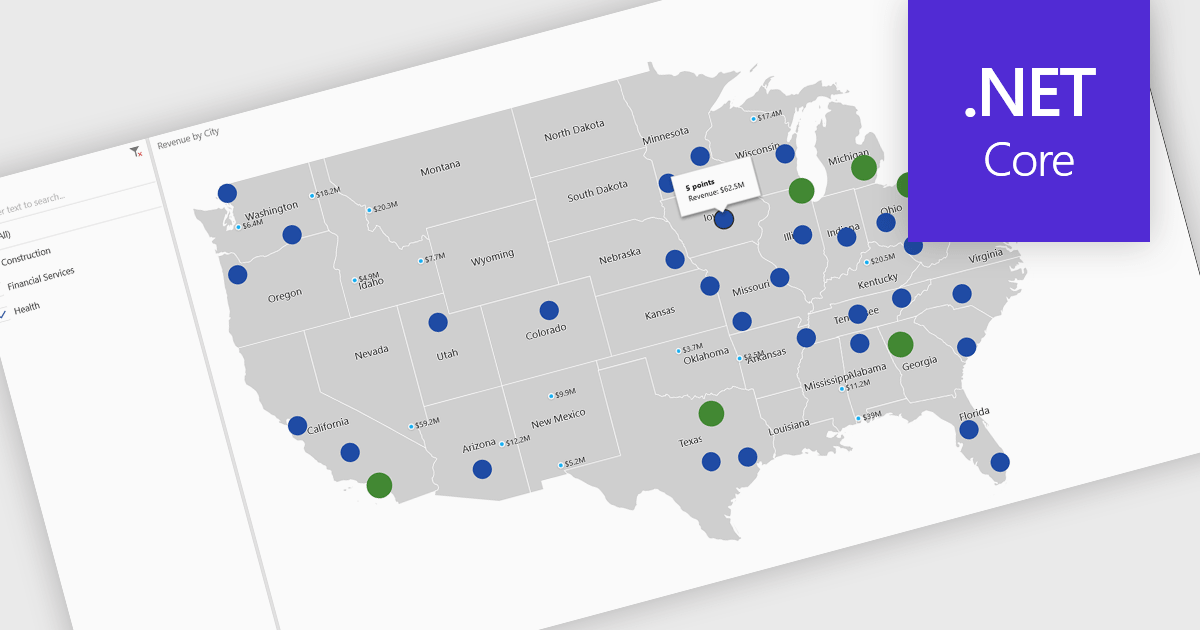
A map chart is a visual representation of data that displays values across geographic regions using colors, shading, or markers, making complex information easier to interpret. By placing data in a spatial context, map charts help users quickly identify regional patterns, trends, and outliers that might be overlooked in traditional tables or graphs. They are particularly useful for comparing values across countries, states, or counties, enabling clearer insights into geographically distributed data. Common use cases include illustrating population density, highlighting election results, analyzing sales performance by region, and presenting economic indicators. The key benefits of map charts include their ability to simplify complex datasets, provide intuitive comparisons, and support data-driven decision-making by visually connecting numbers with real-world locations.
Several .NET Core chart controls offer map charts including:
For an in-depth analysis of features and price, visit our .NET Core chart controls comparison.
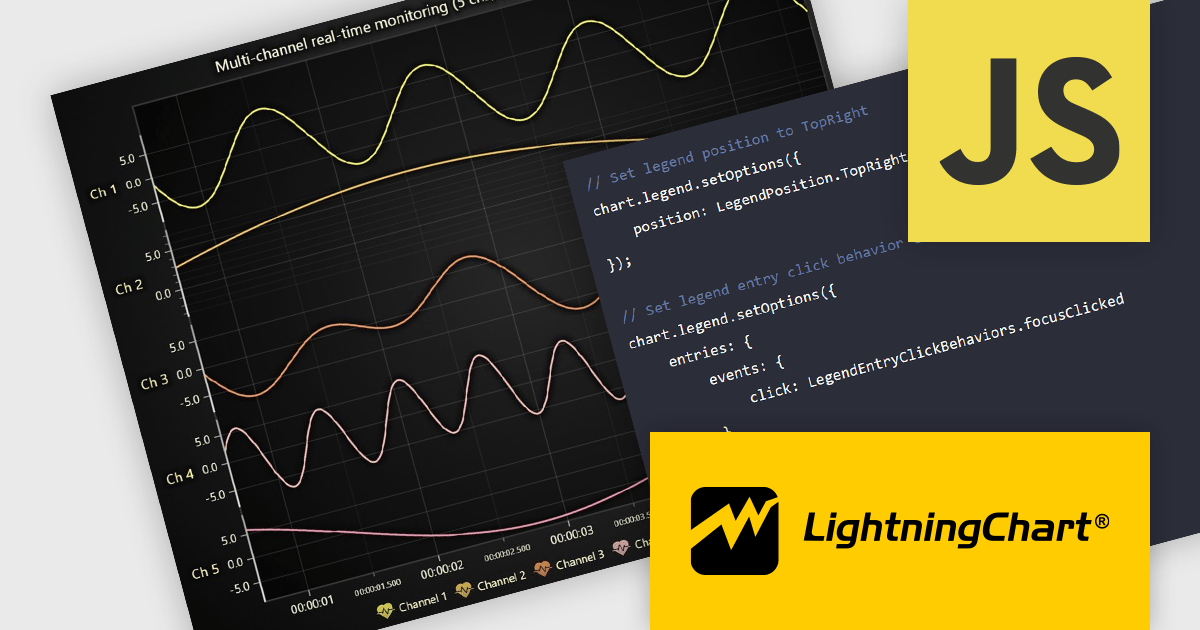
LightningChart JS is a high-performance JavaScript charting library that utilizes WebGL rendering and GPU acceleration to deliver exceptional performance for a wide range of data visualization needs. It is designed to handle large datasets and complex visualizations with ease, enabling developers to create interactive and visually appealing 2D and 3D charts. Ideal for applications demanding smooth real-time data updates, such as financial platforms, engineering tools, scientific research dashboards, and industrial monitoring systems, LightningChart JS provides a comprehensive API for customization and integration into web-based projects.
The LightningChart JS v8.0 update completely reworks legend functionality, making legends a property of the chart, removing visual obstructions, and improving adaptability to available space. The API configuration is now more intuitive and capable, with built-in options supporting a wider range of use cases. Plug‑in support also enables easy extension or customization of legend behavior. By default, legends now appear automatically beneath trends, reducing developer setup time, while still allowing you to manually create multiple legends when needed. You can position legends using built-in presets or define custom placements, and control click behavior using either the provided handlers or your own. When creating series, you can also exclude specific ones from appearing in legends, giving you fine-grained control over legend content.
To see a full list of what's new in v8.0, see our release notes.
LightningChart JS is licensed per developer and is available as an annual license with 1 year support. See our LightningChart JS licensing page for full details.
For more information, see our LightningChart JS product page.
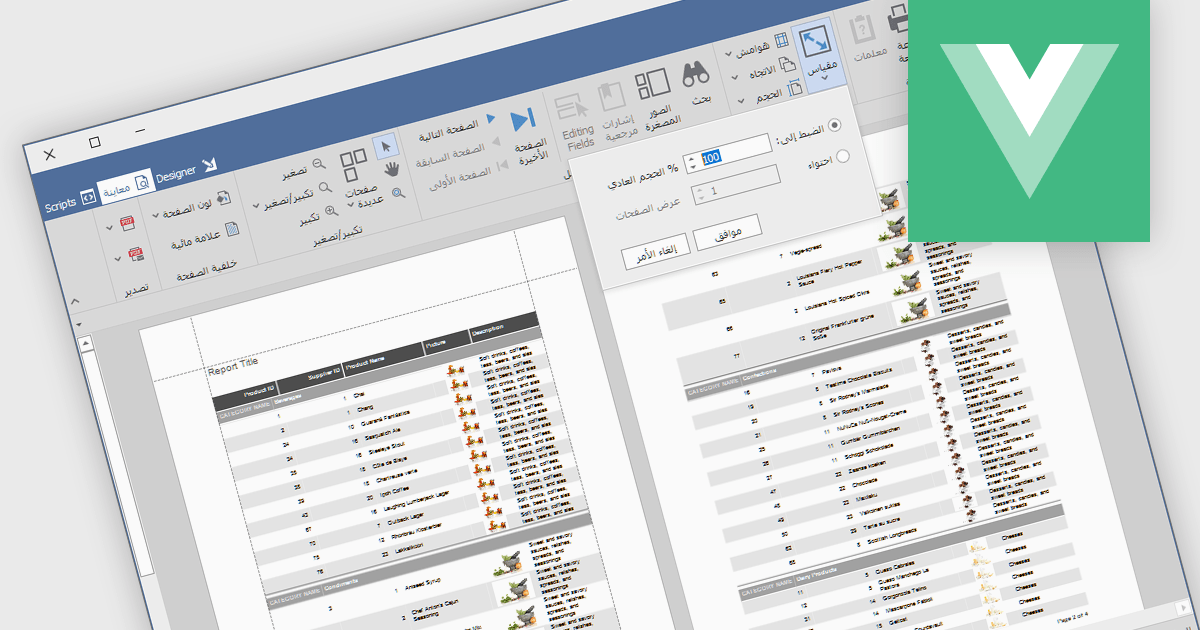
RTL support (Right-to-Left) enables the creation and viewing of reports that can accommodate languages that are read from right to left, such as Arabic, Hebrew, Persian, Urdu, and so on. In the context of report design, this involves aligning text, tables, charts, and interface elements in a way that respects the natural reading direction of said languages, so that the report is displayed correctly for the target audience. Support for RTL languages is a key capability for developers and organizations operating in multilingual environments, ensuring users working in these languages can design, view, and interpret reports accurately and comfortably within the reporting application.
Several Vue.js reporting components include RTL support, including:
For an in-depth analysis of features and price, visit our comparison of Vue.js reporting components.
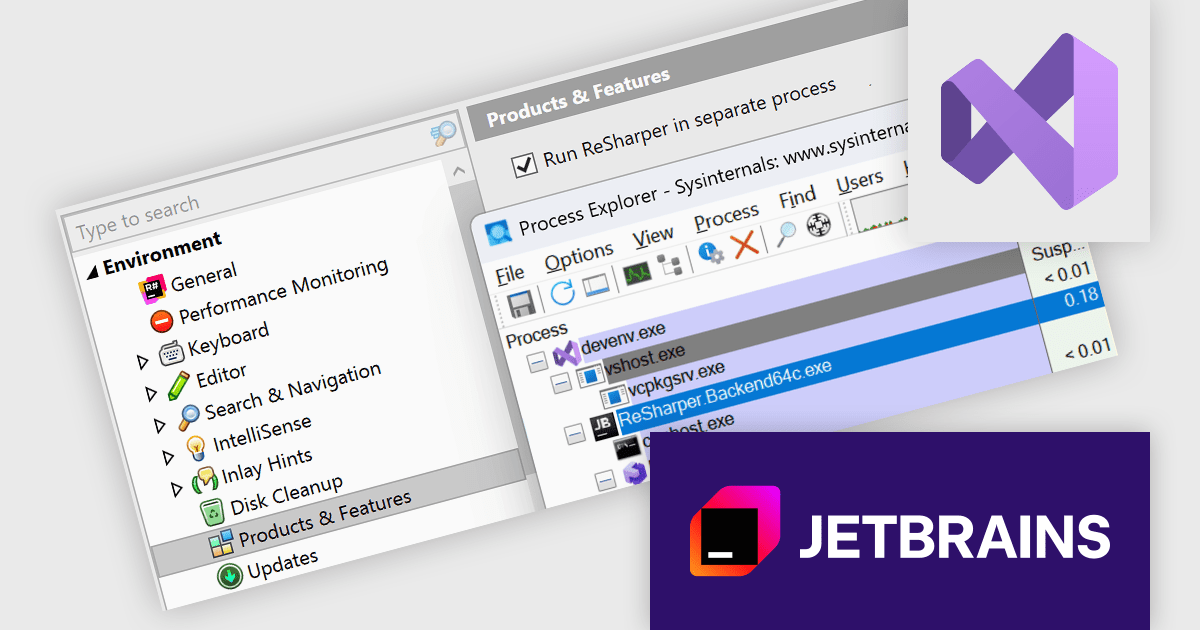
ReSharper is a productivity and code quality plugin for Visual Studio, developed by JetBrains. It helps .NET developers write cleaner, more efficient code. By analyzing code on-the-fly, ReSharper identifies potential errors and suggests fixes. It also automates code refactoring, allowing developers to safely restructure their codebase. These features improve developer productivity and maintainability of the code, making ReSharper a valuable tool for both individual developers and development teams.
The ReSharper 2025.2 release includes a public preview of its new Out-of-Process (OOP) mode, marking the first stable release to support this architectural shift. The key improvement is that ReSharper now runs in a separate process from Microsoft Visual Studio, rather than being embedded directly into the IDE. This change promises to significantly enhance both stability and performance, especially in larger solutions. By isolating ReSharper from the Visual Studio environment, it reduces the likelihood of one tool affecting the responsiveness or reliability of the other. It also opens the door for future optimizations in memory usage and responsiveness, making this an important step forward for .NET developers using the Visual Studio ecosystem.
To see a full list of what's new in version 2025.2, see our release notes.
ReSharper is licensed per user, and is available as a commercial annual subscription license. We can supply new subscriptions, subscription renewals, lapsed renewals, and additional user licenses. See our ReSharper licensing page for full details.
ReSharper is available to buy in the following products:
联系电话: (888) 850 9911
传真: +1 770 250 6199


