Syncfusion Essential Studio for JavaScript 2018 Volume 4

添加 StockChart、TreeGrid 和 Splitter 组件。
12月 18, 2018
新版本

特性

New Components

  • Chip - The Chip control contains a small block of essential information that triggers an event on click action. It also contains the primary text, image, or both, and is mostly used in mail, contacts, or filter tags.
  • Input chip - Basic chip with a delete icon that represents a person or entity and enables the removal of chips from the chip list collection.
  • Choice chip - Used to select an option from those available.
  • Filter chip - Used to select multiple options from those available.
  • In-place Editor - The In-place Editor control is used to edit an element in place with inline and pop-up modes. The control has built-in support to handle all form controls such as text box, drop-down list, date picker, and rich text editor.
  • PDF Viewer - The PDF Viewer component enables you to view and print PDF files:
  • Both normal and PDF files protected with AES and RC4 encryption can be opened and displayed.
  • Core interactions are included: scrolling, zooming, panning, and page navigation.
  • Built-in toolbar.
  • Text can be selected and copied from PDF files.
  • Text can be easily searched for across the PDF document.
  • Easy navigation with the help of bookmarks, thumbnails, hyperlinks, and a table of contents.
  • Two view modes are included: fit-to-page and fit-to-width.
  • An entire document or a specific page can be printed directly from the browser.
  • Query Builder - The Query Builder component is a graphical user interface that allows you to create and edit filters. It outputs a structured JSON of filters that can be easily parsed to create SQL. The control is integrated with Data Manager to communicate with a data source and returns the desired results based on the provided filter. It supports data binding, templates, and horizontal and vertical orientations.
  • Splitter - The Splitter component is a layout user interface (UI) control that has resizable split panes. The container splits into multiple panes that are oriented horizontally or vertically. The separator (divider) splits the panes and is used to resize panes. Place the Splitter control inside a split pane to make a nested layout user interface.
  • TreeGrid - The TreeGrid is a feature-rich control used to visualize self-referential hierarchical data effectively in a tabular format. Its rich feature set includes many functionalities: data binding, editing, sorting, filtering, grouping, paging, aggregating rows, and exporting to Excel, CSV, and PDF formats.
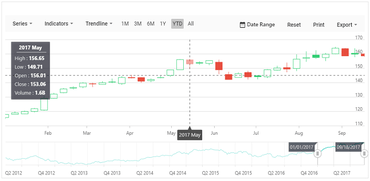
  • StockChart - The StockChart is a feature-rich control used to track and visualize the stock price of any company for a specific period using charting and range tools. Its rich feature set includes many functionalities: data binding, tooltip, crosshair, zooming, panning, and exporting to image and PDF formats. All stock elements are rendered by using Scalable Vector Graphics (SVG).
  • Preview to production - The following components have been moved from preview to production in Essential JS 2:
    • Diagram
    • Word Processor
    • Menu Bar
    • Pivot Table
    • Progress Button
    • Rich Text Editor

Calendar

  • Islamic Calendar - In addition to the Gregorian calendar, the Calendar control supports displaying the Islamic calendar (Hijri calendar).

Chart

  • Lazy loading - Load a chart with data on demand.
  • Pie radius - Pie chart now supports different radii for each slice.
  • Pie center - Change the center of the pie.
  • Gridline and axis label animation - Chart now supports gridline and axis label animation on legend click.

Circular Gauge

  • Radius calculation based on start and end angles - The radius of the circular gauge will be calculated based on the start and end angles to avoid excess white space while rendering semi or quarter circular gauge.

Diagram

  • UML Class Diagram - This feature allows users to create a UML class diagram through code or a visual interface with the built-in class diagram shapes.
  • UML activity diagram - This feature allows users to create a UML activity diagram through code or a visual interface with the built-in activity shapes.
  • Drag limit support for connector’s annotations - This feature allows users to limit the label positions while dragging a label from the connector.
  • CRUD - This feature allows the users to generate a diagram by reading the data from the database, and updating the database with the newly inserted/updated/deleted nodes and connectors.
  • Virtualization - This feature allows users to render a large number of nodes and connectors in a diagram for effective performance.

Dialog

  • Resizable dialog - Resize modal and non-modal (modeless) dialogs. The dimensions of a dialog can be adjusted dynamically using this feature.

DocumentEditor

  • Right to left - The DocumentEditor now supports right to left flow direction for all UI elements like the find and replace pane, dialogs, and more.
  • IME support - The DocumentEditor now supports input method editor (IME) that allows entering complex languages like Japanese, Chinese, etc.

File Upload

  • Sequential upload - The File Upload control processes files sequentially from the queue instead of trying to upload all the files at once.

Grid

  • Row drag and drop - Drag and drop grid rows within the Grid to change row positions dynamically in the UI.
  • Row spanning - This feature allows the user to span adjacent rows using grid events.
  • Printing hierarchy - Print ‘n’ levels of child grids.
  • Exporting grid hierarchy in Excel, CSV, and PDF - Export ‘n’ levels of child grids to Excel, CSV, and PDF formats.
  • Add new row - Add a new row at the bottom of a grid in the UI.

Heatmap Chart

  • Axis label grouping - Group multilevel axis labels in heatmaps.
  • Legend selection - Toggle cell visibility in heatmaps by selecting legend items in the legend.
  • Cell selection - Select a single cell or multiple cells using mouse interactions in heatmaps.

Maps

  • Color mapping enhancements - Now, apply desaturation color mapping for the shapes in Maps along with gradient colors for legend items.
  • Legend enhancements - It is possible to display only the desired legend items for color mapping and to bind legend text from the data source.
  • Selection and highlight - Select or highlight the legend items similar to the shapes in Maps.

Pivot Grid

  • Editing and updating - End users can edit raw items at runtime, simultaneously updating the control.
  • Drill-through - Provides support to easily obtain the list of raw items for a particular value cell or summary cell.
  • Filter dialog - In the filter dialog, provided support to limit display field values and search options to work with large data without any performance constraint.
  • Hyperlink - Allows users to retrieve information about a particular cell through a hyperlink cell click. It also allows users to perform custom operations programmatically.
  • Defer update - End users can refresh the control on-demand rather than during every UI interaction.
  • Show/hide totals - Provided support to show or hide subtotals and grand totals for rows and columns.
  • Aggregations - More aggregation types like distinct count, product, index, population stdev, sample stdev, population var, sample var, running totals, difference from, % of difference from, % of grand total, % of column total, % of row total, % of parent total, % of parent column total, and % of parent column total have been added.

Rich Text Editor

  • Markdown table - This feature allows users to add tables with rows and columns in the Markdown editor.

Schedule

  • Context menu - Context menu can be used with Scheduler now, which opens when the cells or appointments are right-clicked.
  • Block time intervals - A specific time range can be blocked to prevent the creation of appointments in that time slot.
  • External drag and drop - Drag and drop appointments from Scheduler to external sources and vice versa.
  • Read-only events - Specific events can be made read-only on Scheduler, restricting any CRUD actions.
  • Virtual scrolling - Load resources and appointments of timeline views virtually on every scroll action.
  • Improvements on drag action - You can drag appointments on mobile devices using the tapHold event. Improvements to achieve smooth scrolling and auto-navigation across a date range while dragging appointments to the extremities.

Tab

  • Vertical Tab - Provided vertical orientation support in the Tab control, which arranges tab items from top to bottom. The header is positioned at the left or right edges of the Tab control.
  • TreeMap
  • Color mapping enhancements - Now, apply desaturation color mapping for the items in TreeMap along with gradient colors for legend items.
  • Legend enhancements - It is possible to display only the desired legend items for color mapping and to bind legend text from the data source.
  • Selection and highlight - Select or highlight the legend items similar to the items in TreeMap.

TreeView

  • AutoCheck - Provided an option to prevent automatic check/uncheck of the TreeView parent and child checkboxes. Now, each checkbox will act independently.
  • Hierarchical data type support in remote data source - Now, you can use hierarchical data from remote services in the TreeView control.
  • Load on demand - Provided an option to disable the load-on-demand support in TreeView control.
StockChart

Syncfusion Essential Studio JavaScript

用于 JavaScript 的综合性 UI 库。

有任何疑问吗?

透过Live Chat与我们的Syncfusion 专家联络!