FusionCharts Suite XT v3.15.2

添加对 Chord Diagram(和弦图)的事件支持、对 CSS 转换的支持,并改进了 CSV 导出。
7月 14, 2020
新版本

特性

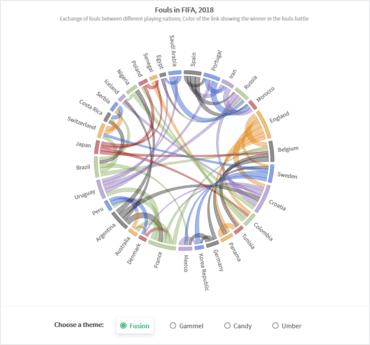
  • Expands the coverage of existing dataPlot events to the nodes and links of the Chord diagram. Events such as Click and Hover as well as support for link attributes were added to nodes, ribbons and labels for Chord diagrams.
  • When exporting spark charts as a CSV file or CSV data using getCSVData() or getChartData('csv')methods, the exported csv now displays column headers.
  • Plot events and tooltips work properly with CSS 2D transformations like rotate, skew, skewX, skewY, matrix, or any combination of them.
  • Crossline tooltips for zoomLine and zoomLineDY charts now display sorted values in decreasing order.
  • Using the isRaw boolean property getJSONData() and getChartData() now return property names in the same format as defined in the dataSource.
  • Legend spacing is optimized to have better data ink ratio for legends in charts to avoid unexpected space between legend items.

修补程序

  • For cartesian axis charts yAxisValueDecimal now works properly when setAdaptiveYMin and forceYAxisValueDecimals are enabled.
  • Decimal and thousand separator attributes now work properly on Marimekko chart.
  • For all 2D and 3D column and bar chart variants, the fontSize and labelFontSize attributes now work properly when set to a string and numeric value. Earlier a JS error was thrown when numeric value was set.
  • The task labels are now displayed properly in Gantt chart and are available on further horizontal scrolling. Previously, the task label overlapped with the vertical scroll bar.
  • The spacing between legend items is improved now for Microsoft Internet Explorer 11. Previously, the spacing was a little peculiar as white-space was being considered as a line break and <br> tags were considered twice.
  • The event handlers chartRollOver and chartRollOutare now working properly when multiple charts are present on a web page. Earlier, when multiple charts were present on a web page with 'chartRollOverandchartRollOut` events, handled by a common handler function, charts stopped invoking the events and threw a JS error upon multiple instances of hover.
  • When using stacked charts, the macros $sum and $unformattedSum are now working properly for customized tooltips. Previously, the $sum and $unformattedSum macros were returning an incorrect value for zero-valued data plot.
  • The '%' symbol is now displayed properly in situations where the trendline value coincides with yAxis div line value for 100percent stacked charts. Earlier the '%' symbol was not visible in such situations.
Chord Diagram.

FusionCharts Suite XT

跨多个设备和平台使用的 JavaScript (HTML5) 图表和量具。

有任何疑问吗?

透过Live Chat与我们的FusionCharts 专家联络!