ChartDirector V7.0

添加新的树形图和离散热图图表类型、对高 DPI 的支持以及对庞大数据集的支持。
5月 12, 2021
新版本

特性

  • Treemap Chart - TreeMap chart is a new chart type in ChartDirector. A treemap chart is similar to a pie chart but it divides a rectangle into multiple rectangles. The child rectangles can be divided into yet more rectangles. So a treemap chart can be used to visualize a tree like data structure with multiple levels of divisions.
  • Discrete Heat Map - Discrete Heat Map is a new layer type for XYChart. It consists of square or rectangular cells colored based on their data values. Like a contour layer, a discrete heat map layer contains a color axis that maps data values to colors.
  • Circular Bar Meter - A circular bar meter is like a linear bar meter, but with the bar bending in a circular direction. By using an angular gradient, the colors along the bar can vary depending on the meter value. The center of the meter can be used to display the meter value in text.
  • Multi-Page PDF Output - The PDF output feature of ChartDirector has been extended to allow generating a PDF with multiple pages. Each page can contain multiple charts as well as free form text, tables, drawings and images. That means ChartDirector can now generate complete PDF reports.
  • Huge Data Set Support - With the new DataAccelerator object, ChartDirector can plot charts with a billion data points, with smooth zoom, scroll and track cursor support and updating at thousands of data points per second in real time.
  • High DPI Support - ChartDirector GUI controls, such as the chart viewer controls and viewport controls in C++ and .NET, will now automatically detect if the application is high DPI aware and will resize and render the charts at the detected DPI. There are also APIs to force the charts to render at a given DPI.
  • CDML Tooltip - ChartDirector GUI controls now support tooltips formatting with CDML (ChartDirector Mark Up Language). This allows rich formatting of the tooltips, semi-transparent tooltip container and allows the tooltips to contain icons and images.
  • CDML Enhancements - CDML adds support for containers with rounded corners, configurable margins and polyshape symbols.
  • Contour Labels - Added the ability to draw labels along the contours in a contour chart or heat map. This allows contour values to be displayed directly on the contours, instead of having to lookup their values based on the underlying colors.
  • Contour Cross Section - ChartDirector can now compute the cross section between two points on a contour chart or heat map. The cross section is represented as the z values along a straight connecting the two points.
  • Contour Tooltip - Added support for continuously varying tooltips on a contour chart or heat map to display the (x, y, z) values as the mouse moves.
  • Contour getZAtPixel - Added a new API ContourLayer.getZAtPixel for obtaining the z value at any (x, y) position on a contour chart or heat map.
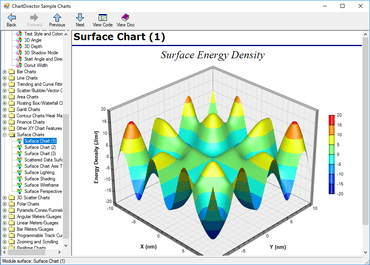
  • 4D Surface - In a surface chart, the surface is defined with (x, y, z) coordinates. By default, the z coordinate also determines the surface color. Support for using an extra coordinate w for the surface color has been added.
  • Surface XY Projection - The projection of a surface chart on the XY plane is a contour chart. ChartDirector can now include the projection on the XY wall of the surface chart.
  • Surface Lines and Zones - Added support for including custom line segments and rectangular zones on the surface or a surface chart.
  • Surface Texture - ChartDirector now supports drawing a custom image on the surface of a surface chart, The image can be semi-transparent so as not to block the underlying surface. The image can be generated on the fly by using another chart or the DrawArea object. This feature is useful for adding custom annotations on the chart.
  • Surface Tooltip - ChartDirector now supports continuously varying tooltips on a surface chart to display the (x, y, z, w) values as the mouse moves.
  • Surface getValuesAtPixel - Added a new API SurfaceChart.getValuesAtPixel for obtaining the (x, y, z, w) values any pixel position on a surfaced chart.
  • Surface Chart output in PDF/SVG - This release now uses hybrid rendering methods. The 3D parts are pre-rendered by ChartDirector while the text, lines and 2D parts of the chart are rendered using PDF/SVG graphics. The resulting PDF/SVG is much smaller and can be viewed by common PDF/SVG viewers and browsers.
  • Keep Aspect Ratio Zooming - Added a "keep aspect ratio" mode to keep the aspect ratio unchanged during zooming. This is useful for contour charts related to geographic maps of which the x and y directions must zoom by the same factor.
  • Angular Gradient Color - Added support for angular gradient color, which is a gradient that changes color depending on the bearing of the pixel relative to a center point.
  • X-Scale Color and Y-Scale Color - In previous versions of ChartDirector, color scales are used to define the colors based on the z values for contour and surface charts. This release extends this to support coloring objects based on the x and y values in XY charts.
  • ColorAxis.getColorScale - Added the ability to export the color scale of a color axis. The color scale can be used in other charts to ensure they have consistent colors.
  • Axis.syncScale - Added a new Axis.syncScale API to only synchronize the axis scale. In contrast, the existing Axis.syncAxis API synchronizes both the axis scale and geometry.
  • XY Size for Symbols - Added a new API xySize that can encode different width and height into a single size parameter.
  • Legend Box CDML Text Item - A legend item in ChartDirector's legend box typically contains an icon, followed by text that describes what the icon means. ChartDirector 7.0 adds support for a pure text item. The text can be CDML (ChartDirector Mark Up Language) formatted. It can be used to add headings or empty lines to separate the legend items into sections, or to add legend items with icons in non-standard positions.
  • PolyShape Support - Added support for compound shapes filled using the even-odd rule. It is now possible to make a hexagon symbol with a transparent circular hole inside by combining a hexagon and a circle inside. The even-odd rule means the region inside the circle is not filled at all, so it becomes a transparent hole.
  • Font Specification - In previous versions of ChartDirector for C++, Perl, Python, PHP and ASP/COM/VB, fonts are specified using their file names. This release also allows fonts installed in the Microsoft Windows or Apple macOS operating system to be specified with their family names, followed by optional "Bold" and/or "Italic" keywords. Font file names remain supported as they are useful for private fonts or fonts embedded as resources in the executable.
  • Open Type Font with Postscript Outlines (CFF Font) Support - In previous versions for C++, Perl, Python, PHP and ASP/COM/VB, only true type fonts (including open type fonts with true type outlines) are supported. This release adds support for open type fonts with postscript outlines too.
  • Text Rendering Change - This release uses a new text rendering engine with more accurate text positioning. The text length and text shape may change slightly.

Note: Advanced Software Engineering are in the process of updating ChartDirector to 7.0. Currently, ChartDirector for C++, Python and Perl are on version 7.0, while ChartDirector for .NET, Java, ASP/COM/VB and PHP are still on version 6.x.
ChartDirector

ChartDirector

用 PNG、JPEG、BMP、WBMP、PDF 和 GIF 中创建几乎所有浏览器都可以查看的图表,包括移动和手持设备。

有任何疑问吗?

透过Live Chat与我们的Advanced Software Engineering 专家联络!