
Vizuly Line Area Chart
将线条和面积图添加到您的 JavaScript 应用中。
Vizuly Professional includes all Vizuly components at a significant discount.
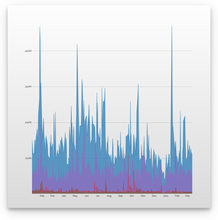
Vizuly Line Area Chart supports both line and area plots in several different layout options. It also comes bundled with a test container demonstrating the various chart properties and different style themes. You can either drop this component directly into your application using its straightforward API, or use it as a starting point for modification and extension.


图像1/6
Features
Framework Adapters
Vizuly Line Area Chart亦以___提供
透过Live Chat与我们的Vizuly 专家联络!
联系电话: (888) 850 9911
传真: +1 770 250 6199


