PostSharp Ultimate
将设计模式和线程安全添加到 C# 和 vb。
线程安全 - 以 .NET 语言开始新的线程和任务十分简单,但要确保对象的线程安全则不然。 选择您想要的线程模型,并且内置验证功能来检测代码中的错误。.

说明: Build your own aspects and start eliminating boilerplate from your.NET codebases. PostSharp Framework is a pattern-aware compiler extension for C# and VB. Build automation for your own patterns to reduce development effort and improve architecture. With ... 阅读更多

说明: Add patterns and thread safety to C# and VB. PostSharp Ultimate allows developers to eradicate boilerplate code by offloading repetitive work from humans to machines. It contains ready-made implementations of most common patterns and gives you the tools ... 阅读更多

说明: Add highly detailed logging to your.NET projects with zero impact on source code. PostSharp Logging (formerly PostSharp Diagnostics) is an instrumentation toolbox for.NET and.NET Core. It allows you to add extensive logging to your application in minutes ... 阅读更多

说明: A radial line and area layout visualization. Vizuly Corona is a radial chart that provides angular and curved radial area line curves and supports both an overlap and stacked layout. It also features over a dozen different dynamic styles and comes bundled ... 阅读更多

说明: Represent transactional relationships from a specified number of sources to a variable number of targets. Vizuly Halo uses several different data visualization techniques to represent transactional relationships from a specified number of sources to a ... 阅读更多

说明: Represent cartesian x/y data within a radial plot. Vizuly Radial Bar is designed to represent cartesian x/y data within a radial plot. It supports both clustered and stacked radial bars Use the interactive style explorer on the left to view different ... 阅读更多

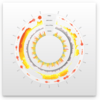
说明: Easily display multi-variate time series information. Vizuly Ring Chart lets you easily display multi-variate time series information. Due to its radial form factor, you can display 3 times the information for a given screen width than you could with a ... 阅读更多

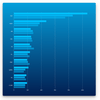
说明: Add stacked and clustered bar charts to your JavaScript apps. Vizuly Bar Chart supports both stacked and clustered layout options, as well as over 2 dozen different dynamic styles. It also comes bundled with a test container and examples of different ... 阅读更多

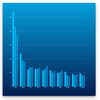
说明: Add stacked and clustered column charts to your JavaScript apps. Vizuly Column Chart supports both stacked and clustered layout options, as well as over 2 dozen different dynamic styles. It also comes bundled with a test container and examples of ... 阅读更多

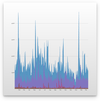
说明: Add line and area charts to your JavaScript apps. Vizuly Line Area Chart supports both line and area plots in several different layout options. It also comes bundled with a test container demonstrating the various chart properties and different style ... 阅读更多