








Offizieller Lieferant
Als offizieller und autorisierter Distributor beliefern wir Sie mit legitimen Lizenzen direkt von mehr als 200 Softwareherstellern.
Sehen Sie alle unsere Marken.
Infragistics Ultimate is a comprehensive development toolkit designed to streamline the creation of high-performance, visually rich applications across multiple platforms. It includes a wide range of user interface (UI) components and development tools for web, desktop, and mobile applications, supporting frameworks such as Angular, React, Blazor, .NET, and more.
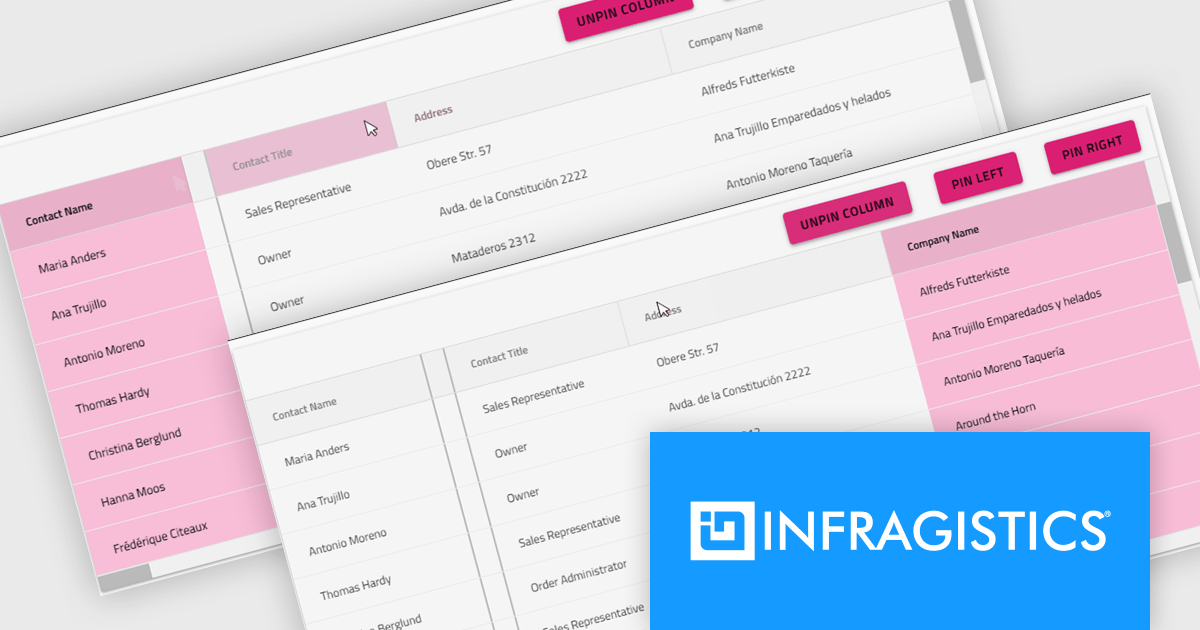
The Infragistics Ultimate 25.2 release includes a feature that lets developers specify individual pinning locations for each grid column, making it possible to fix important data on both the left and right edges of a grid. This added flexibility helps create cleaner, more efficient layouts that keep key information visible at all times. Whether you’re working in Angular, React, Web Components, or Blazor, this capability improves data presentation, simplifies large dataset navigation, and enhances the overall usability of modern web applications.
To see a full list of what's new in version 25.2, see our release notes.
Infragistics Ultimate is licensed per developer and is available as a Perpetual License with a 1, 2 or 3 year support and maintenance subscription. See our Infragistics Ultimate licensing page for full details.
For more information, visit our Infragistics Ultimate product page.
Highcharts Grid Pro is a versatile data grid component developed by the creators of Highcharts, offering both standalone functionality and tight integration within the Highcharts and Highcharts Dashboards ecosystems. It features advanced capabilities such as real-time data binding, column sorting, filtering, inline editing, pagination, and data export, enabling users to work with structured data efficiently. Designed to complement Highcharts' visual components, Grid Pro allows for seamless alignment between data tables and interactive charts when used together, but it can also function independently in applications that require only tabular data interaction. This makes it ideal for a wide range of use cases, including financial platforms, business intelligence tools, and any application where users need to view, edit, and interact with complex datasets directly in the browser.
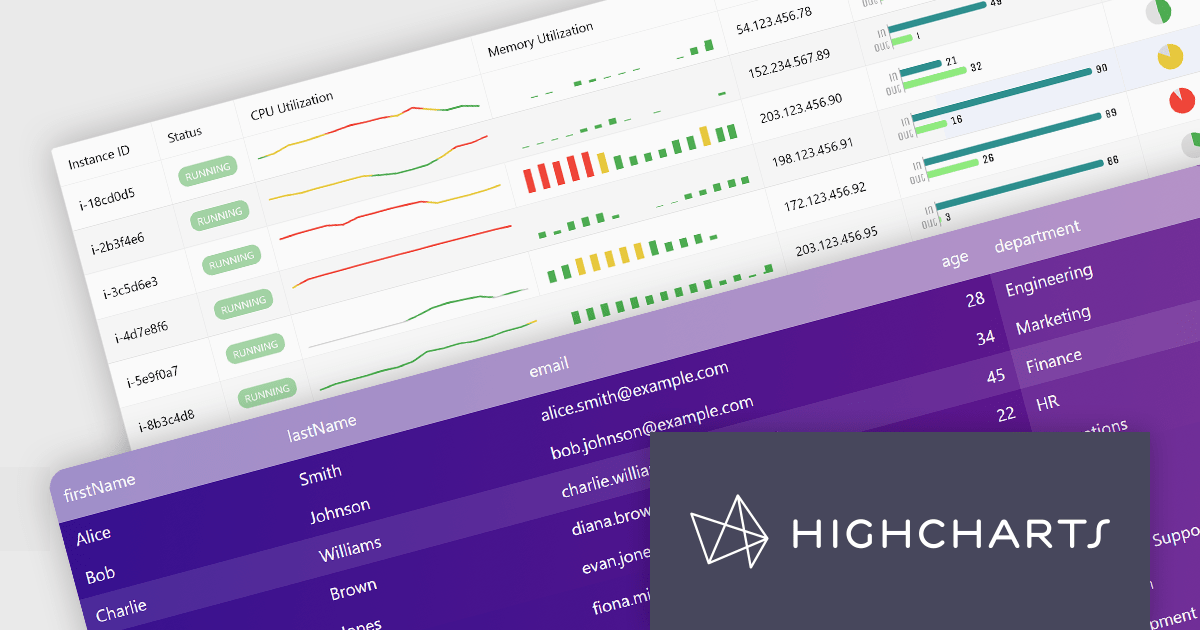
Highcharts Grid Pro is now available as a standalone component. The v2.0 update delivers a set of professional-grade enhancements focused on improving usability, data control, and visual clarity. It introduces interactive editing with built-in editors for text, numbers, and dates, making in-grid updates more intuitive. Configurable validation rules ensure data accuracy, while embedded sparklines, powered by Highcharts Core, provide immediate visual insights alongside the data. Features such as pagination, column filtering, and sorting make it easier to manage and explore large datasets. Developers can also implement custom behaviors and event hooks to align the grid with specific application needs.
For a limited time you can benefit from special introductory pricing!
Save 50% off new licenses of Highcharts Grid Pro or Highcharts Dashboards when bought individually or when combined in a bundle with other products from Highsoft including Highcharts Core, Stock, Maps and Gantt.
Highcharts Grid Pro is licensed per developer as an Annual or Perpetual License with Internal, Saas, SaaS+ and OEM distribution options. The annual license includes support and all product updates for 1 year and must be renewed to continue to use the software. The perpetual license includes an "Advantage Subscription" which provides support and updates for a set period of time. If you do not renew Advantage then you may continue to use the software at the last release available during the active Advantage period. See our Highcharts Grid Pro licensing page for full details.
Learn more on our Highcharts Grid Pro product page.
DevExpress Reporting is a comprehensive suite of reporting tools that help developers create visually stunning and highly customizable reports for various applications. With its rich feature set, including data binding, layout design, printing, and exporting capabilities, DevExpress Reporting enables the efficient creation of reports that meet the most demanding business requirements.
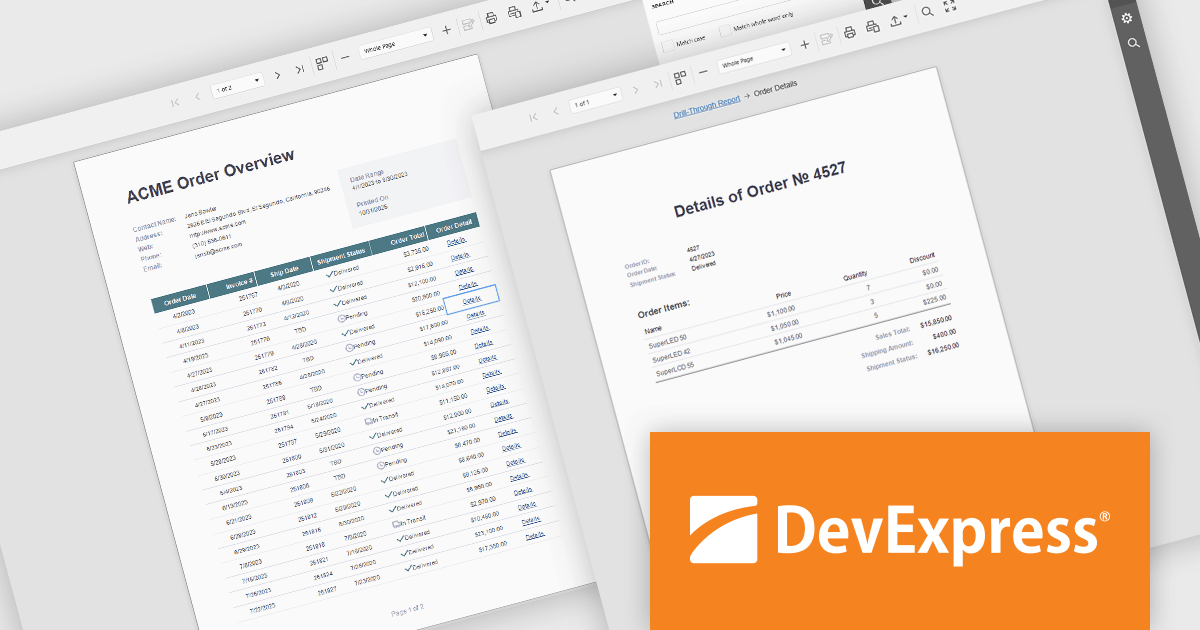
DevExpress Reporting enhances data analysis by enabling drill-through reports, allowing developers to create interactive report designs that link summary-level data to detailed information. This feature provides a streamlined way for users to explore data hierarchies without leaving the main report, improving usability and workflow efficiency. By clicking on data points, users can view related details in a connected report, ensuring a cohesive and intuitive data exploration experience. This capability helps developers deliver more dynamic, context-rich reporting solutions that support faster and more informed decision-making.
DevExpress Reporting is licensed per developer and is available as a Perpetual License with a 12 month support and maintenance subscription. See our DevExpress Reporting licensing page for full details.
DevExpress Reporting is available to buy in the following products:
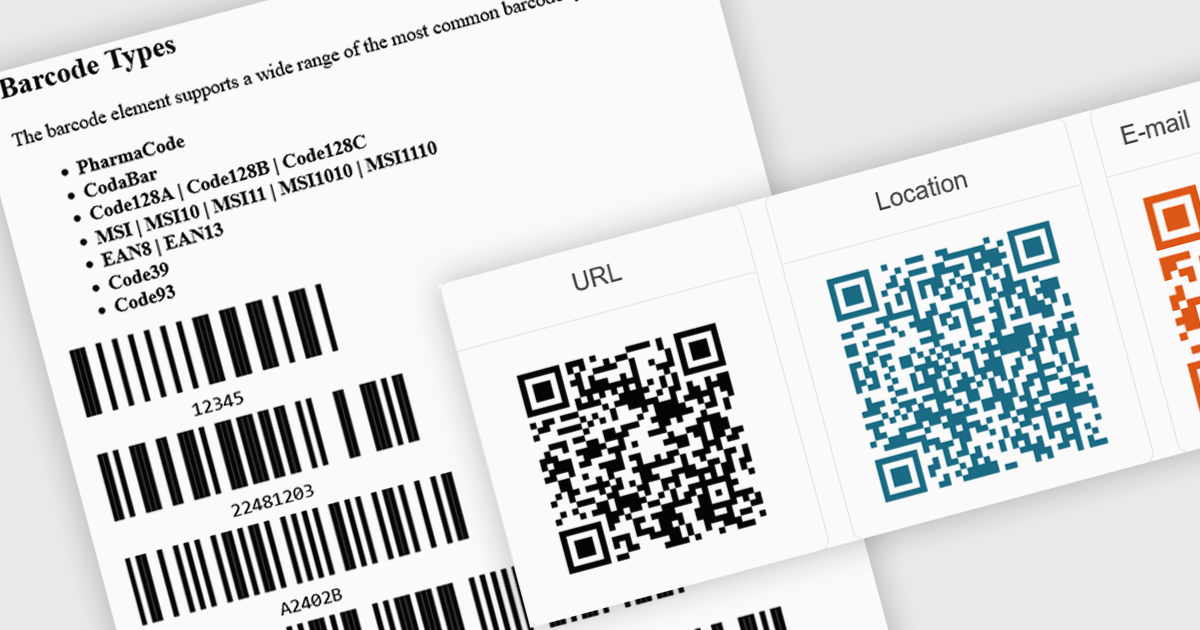
Barcode support in an Angular UI suite refers to built-in components that allow developers to generate and display barcodes directly within their applications. This capability simplifies the integration of barcode-based workflows, such as inventory tracking, product labeling, or user identification, without relying on third-party libraries. By handling various barcode standards and formats natively, these components ensure consistency in rendering and decoding, reduce development time, and enhance application performance and reliability when working with barcode data.
Several Angular UI suites provide barcode controls, including:
For an in-depth analysis of features and price, visit our comparison of Angular UI Suites.
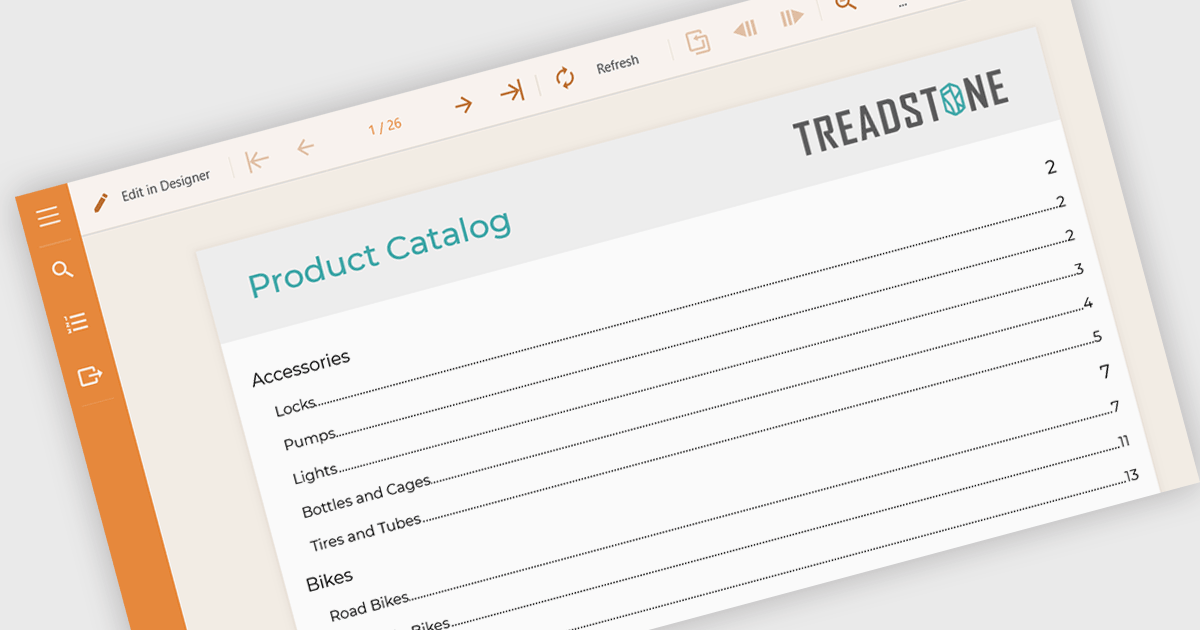
Table of Contents (TOC) support in a reporting component allows developers to automatically generate a structured overview of a report’s sections, typically displayed at the beginning of the document. This feature helps users navigate long or complex reports by providing direct links or page references to key sections, mirroring the layout and hierarchy of the report's content. For developers, it reduces the need to manually maintain navigation aids, improves the report’s usability, and enhances the professional appearance of exported formats like PDF or Word. TOC support is especially beneficial in compliance-heavy or audit-focused applications where clear documentation structure is essential.
Several Angular reporting controls offer Table of Contents (TOC) support including:
For an in-depth analysis of features and price, visit our comparison of Angular reporting controls.





Tel.: (888) 850 9911
Fax: +1 770 250 6199


