Offizieller Lieferant
Als offizieller und autorisierter Distributor beliefern wir Sie mit legitimen Lizenzen direkt von mehr als 200 Softwareherstellern.
Sehen Sie alle unsere Marken.
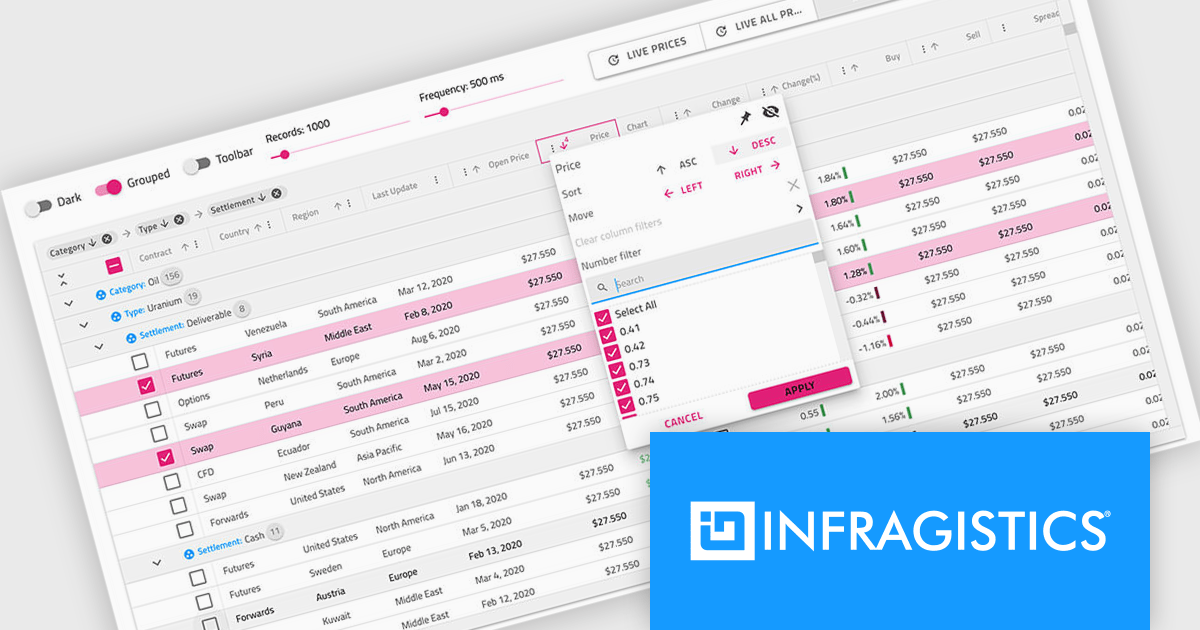
Infragistics Professional is a comprehensive toolkit for software developers, offering a wide range of pre-built, high-performance UI components for building visually appealing and feature-rich applications across Angular, React, Web Components, Blazor, ASP.NET MVC, ASP.NET Core, Windows Forms, WPF and Xamarin. It includes controls such as data grids, charts, navigation menus, and more, along with productivity tools to streamline development processes.
Infragistics Professional delivers a powerful Angular Data Grid Component that enables developers to efficiently display, manage, and interact with large datasets in modern web applications. Designed for performance and scalability, it offers advanced features such as editing, sorting, filtering, and data export, all seamlessly integrated into the Angular framework. This allows developers to build responsive, real-time data experiences that meet the demands of enterprise-grade applications.
Infragistics Professional is licensed per developer and is available as a Perpetual License with a 1, 2 or 3 year support and maintenance subscription. See our Infragistics Professional licensing page for full details.
The Ignite UI for Angular Data Grid is available in the following products:
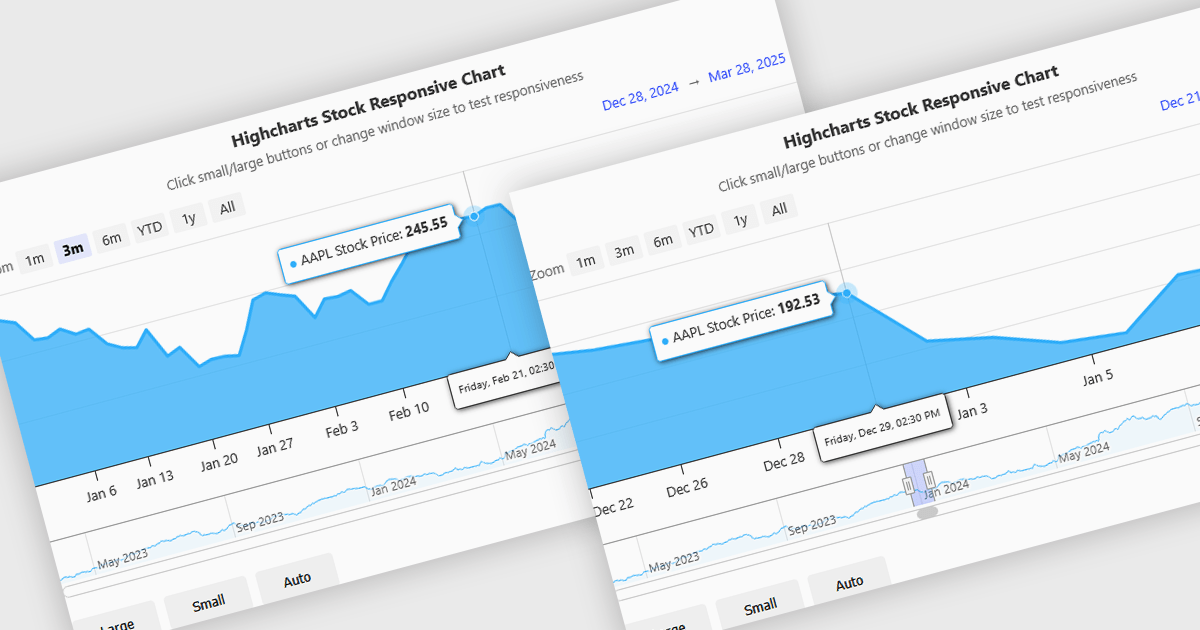
Responsive behavior in chart controls refers to the automatic adjustment of a chart’s layout, dimensions, and visual elements to fit the screen size or container in which it is rendered. This functionality ensures that charts remain readable and usable across a wide range of devices, from desktops to tablets and smartphones, without requiring manual configuration for each format. The benefits include reduced development overhead, improved user experience, and consistent presentation of data regardless of platform. Common use cases include dashboards in web applications, analytics platforms, and mobile-first reporting tools, where users expect seamless interaction and clear data visualization across multiple device types.
Several JavaScript chart controls support responsive behavior, including:
For an in-depth analysis of features and price, visit our JavaScript chart controls comparison.
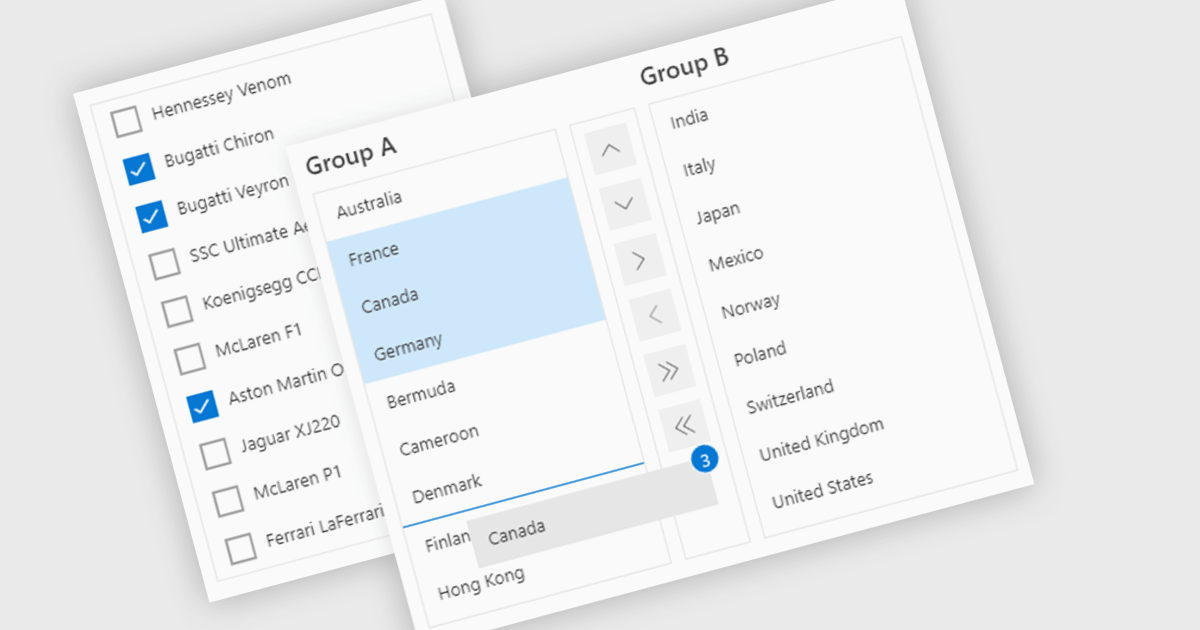
ListBoxes are user interface components in data editors that enable users to select one or more values from a predefined list. They help improve data entry by reducing manual input, ensuring consistent data, and minimizing errors. Commonly used in forms, data grids, and configuration panels, ListBoxes support both static and dynamic data sources, allowing for context-aware filtering and responsive interfaces that adapt to user selections.
Several Angular data editors support listboxes, including:
For an in-depth analysis of features and price, visit our Angular data editors comparison.
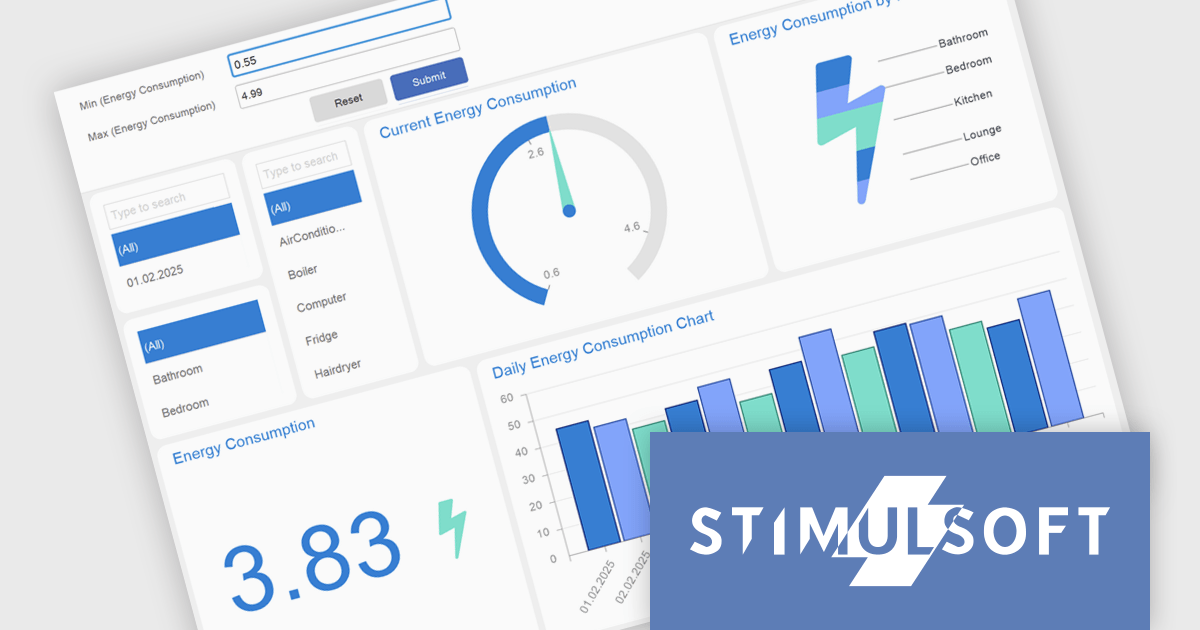
Stimulsoft Dashboards.WEB is a versatile suite of tools for crafting interactive data visualizations for web and desktop applications. It empowers developers to embed intuitive dashboards across various platforms, using the platform-specific components or a centralized cloud designer. With rich data analysis elements, extensive customization options, and pre-built templates, Stimulsoft Dashboards helps you transform complex data into clear, actionable insights for any audience.
The Stimulsoft Dashboards.WEB 2025.2.1 update introduces support for expressions in Gauge range fields, enabling developers to calculate minimum and maximum range bounds dynamically based on underlying data. This enhancement allows for greater flexibility in building responsive dashboards, as Gauge elements can now reflect real-time values without requiring manual adjustments. By integrating expressions directly into the range logic, developers can implement more sophisticated data visualizations that adapt to changing inputs and business logic. This feature streamlines development and supports more efficient maintenance of dynamic reporting scenarios.
To see a full list of what's new in 2025.2.1, see our release notes.
Stimulsoft Dashboards.WEB is licensed per developer and is available as a perpetual license with 1 year support and maintenance. See our Stimulsoft Dashboards.WEB licensing page for full details.
Stimulsoft Dashboards.WEB is available individually or as part of Stimulsoft Ultimate.
Wijmo by MESCIUS is a comprehensive JavaScript library offering a suite of high-performance UI components and data grids specifically designed to streamline the development of modern enterprise applications. It emphasizes reduced development time and improved maintainability, along with a focus on performance through its efficient design and small module size. Wijmo integrates seamlessly with popular JavaScript frameworks like Angular, React, and Vue.js, and supports cutting-edge technologies like TypeScript, making it a versatile solution for building complex web applications.
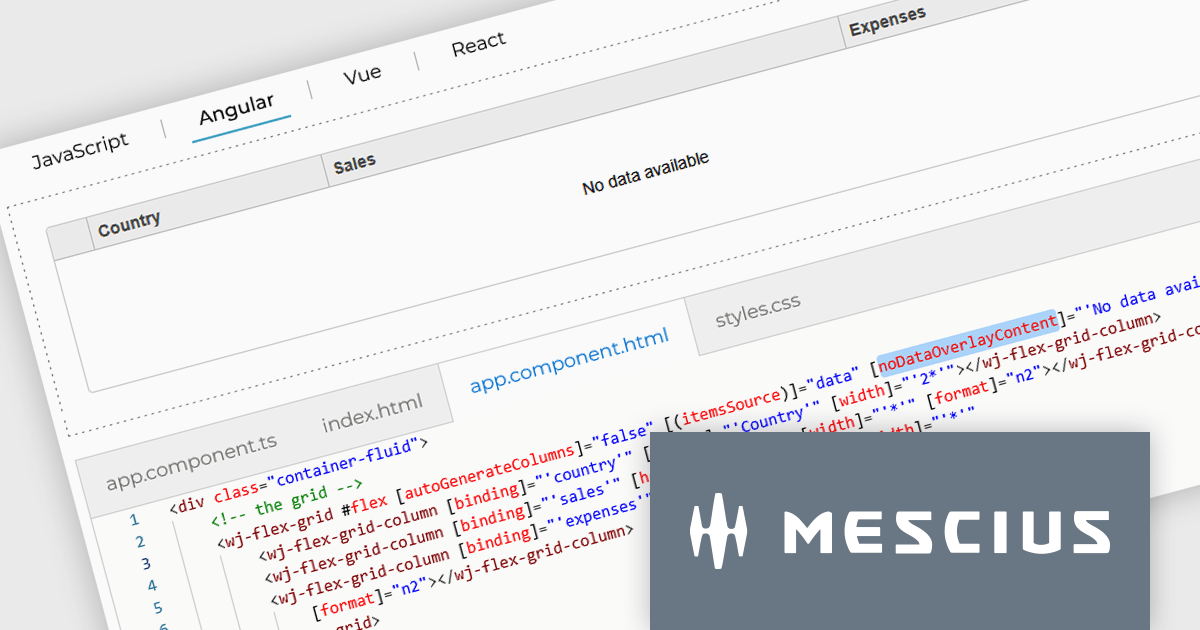
The Wijmo 2025 v1 update introduces a customizable noDataOverlayContent property, enabling developers to display tailored HTML messages when grid data is empty. This improves user experience by replacing blank grid views with informative content, while the new overlayManager allows advanced control over how overlays are rendered and managed. The release also expands framework support, adding compatibility with Angular 19 and Next.js 15 to help developers stay current with modern web development tools.
To see a full list of what's new in 2025 v1 (Build 5.20251.34), see our release notes.
Wijmo is licensed per developer. Developer Licenses are perpetual and include 1 year Subscription which provides upgrades, including bug fixes and new features. See our Wijmo licensing page for full details.
Learn more on our Wijmo product page.