


Offizieller Lieferant
Als offizieller und autorisierter Distributor beliefern wir Sie mit legitimen Lizenzen direkt von mehr als 200 Softwareherstellern.
Sehen Sie alle unsere Marken.
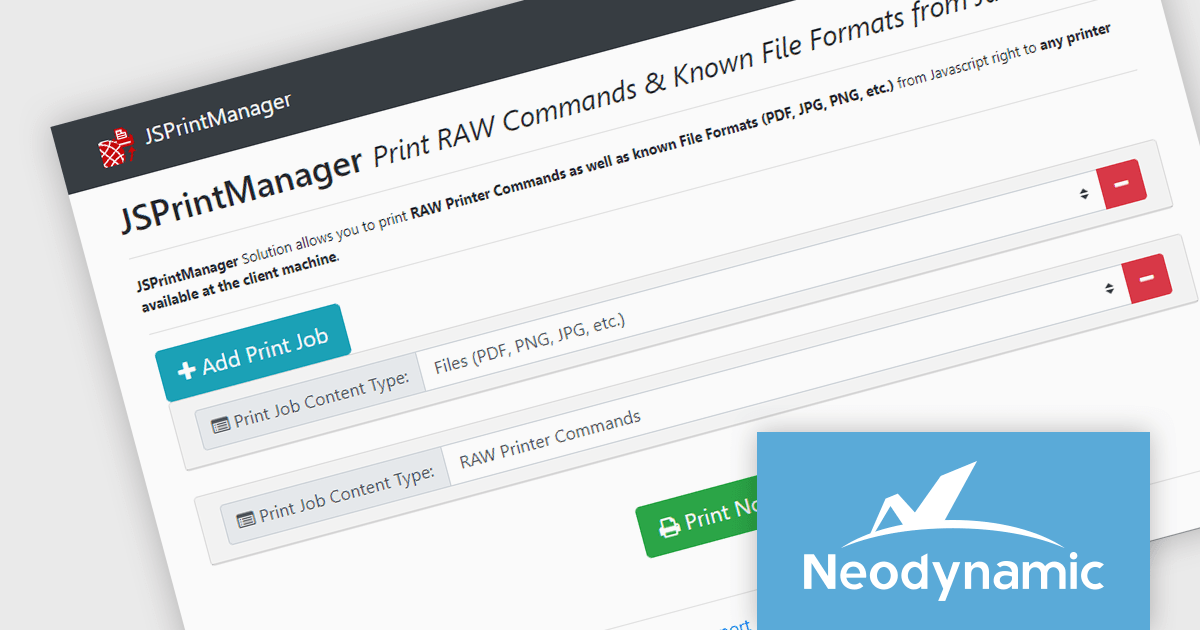
Neodynamic offers two JSPrintManager solutions for client-side printing and scanning in web applications. JSPrintManager for Any Web Platform allows you to integrate printing functionality into any website built with technologies like ASP.NET, PHP, or Blazor using pure JavaScript. Neodynamic also offers JSPrintManager for Blazor which enables you to seamlessly add printing capabilities to your Blazor server or WebAssembly projects with C# code. Both solutions empower you to print various data formats directly from the browser without requiring user interaction with print dialogs.
The Neodynamic JSPrintManager 7.0 releases add a new JS printerDeleteAllJobs function to delete all print jobs in a given printer queue. This enhances control over print queues directly from web applications, allowing developers to manage print jobs efficiently, particularly for scenarios where users might accidentally send multiple files or need to clear the queue before a critical print.
To see a full list of what's new in 7.0, see our release notes for JSPrintManager for Any Web Platform and JSPrintManager for Blazor.
Neodynamic JSPrintManager is licensed per Web App and Web server and is available as a Perpetual license which includes 1 year of free updates and priority support. See our Neodynamic JSPrintManager for Any Web Platform licensing page and Neodynamic JSPrintManager for Blazor licensing page for full details.
Learn more on our Neodynamic JSPrintManager for Any Web Platform and Neodynamic JSPrintManager for Blazor product pages.
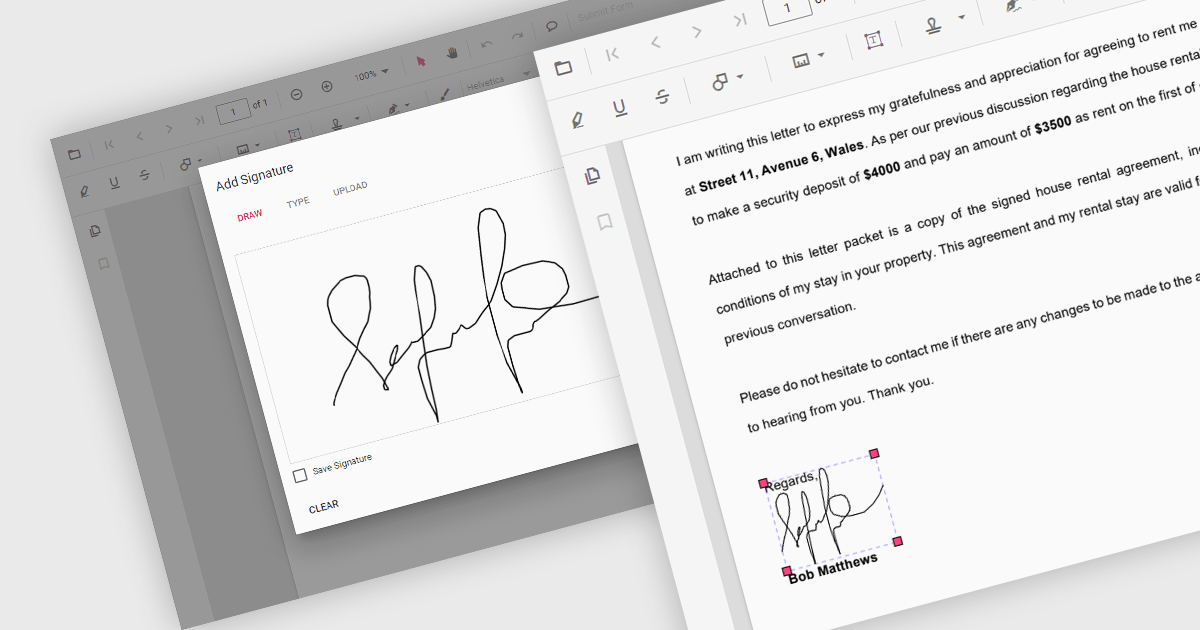
Handwritten signature support in React PDF viewers allows users to add their personal signatures directly onto PDF documents within applications built using the React framework. This functionality enhances document security, as it enables the verification of document authenticity and signer identity. It supports a seamless user experience, integrating easily with other digital processes, and adhering to legal standards that recognize electronic signatures, thus facilitating compliance with regulatory requirements.
Several React PDF Viewer components support handwritten signatures, including:
For an in-depth analysis of features and price, visit our comparison of React PDF Viewer components.
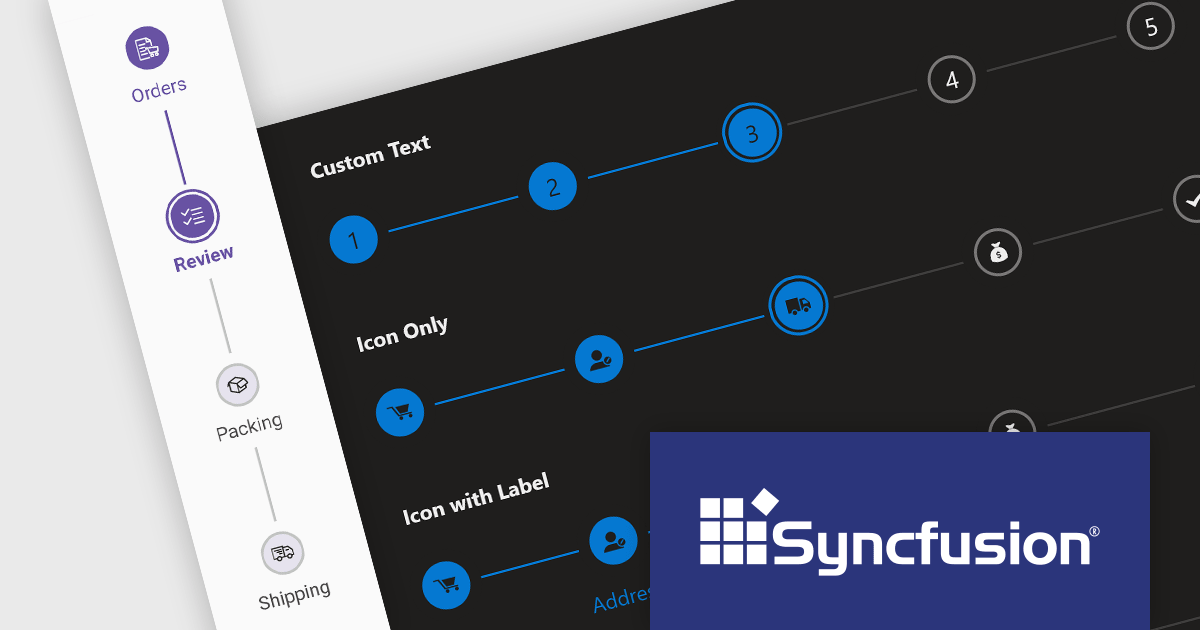
Syncfusion Essential Studio JavaScript, available as part of Syncfusion Essential Studio Enterprise, is a comprehensive UI library offering over 80 high-performance, lightweight, and responsive components to transform your web apps. Built from scratch with TypeScript, it boasts modularity and touch-friendliness, letting you pick and choose specific features while ensuring smooth mobile interaction. With rich themes, global accessibility features, and extensive documentation, it powers everything from basic buttons to interactive charts and data grids, simplifying front-end development across JavaScript, Angular, React, and Vue.
The Syncfusion Essential Studio JavaScript 2024 Volume 1 (25.1.35) release introduces the production-ready Stepper component which simplifies the creation of wizards and walkthroughs within your web applications. It provides a user-friendly interface to guide users through a step-by-step process, enhancing the overall user experience. The component offers a variety of step types, orientations, and customization options to perfectly suit your specific requirements.
To see a full list of what's new in version 2024 Volume 1 (25.1.35), see our release notes.
Syncfusion Essential Studio JavaScript is available as part of Syncfusion Essential Studio Enterprise which is licensed per developer starting with a Team License of up to five developers. It is available as a 12 Month Timed Subscription License which includes support and maintenance. See our Syncfusion Essential Studio Enterprise licensing page for full details.
For more information, visit our Syncfusion Essential Studio JavaScript product page.
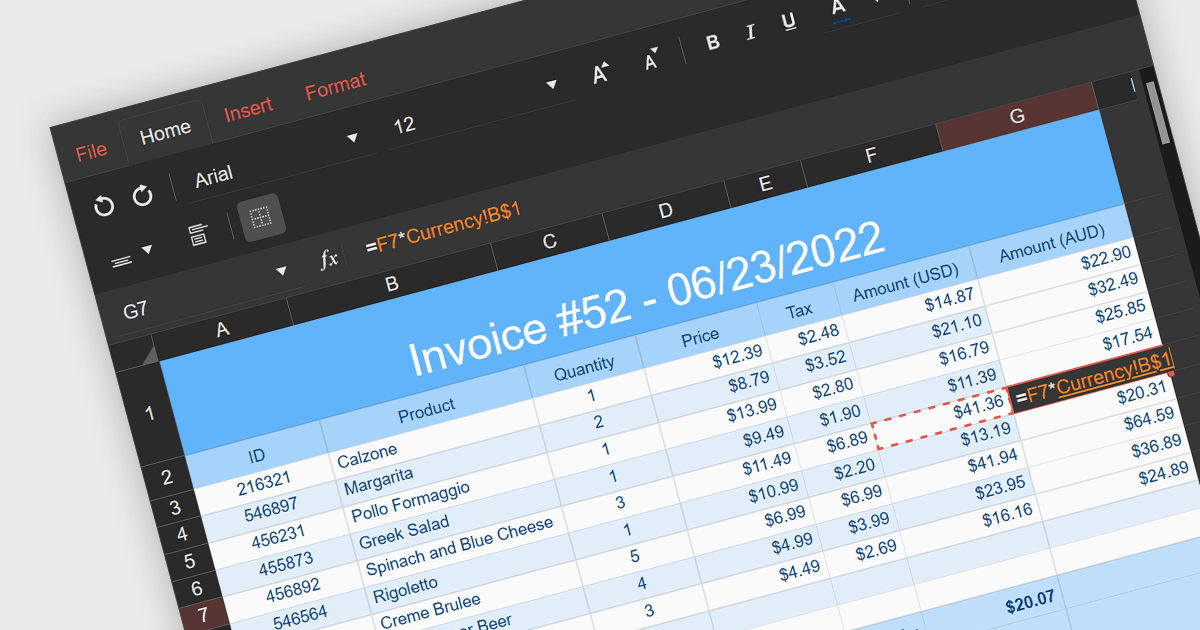
Cross-worksheet calculations involve using formulas within spreadsheet applications to reference and manipulate data across multiple worksheets within the same workbook. This allows you to consolidate and analyze information from various sections of your spreadsheet without consolidating it into a single worksheet. The ability to carry out such calculations simplifies complex operations enhances the efficiency and effectiveness of data organization and analysis.
Several React spreadsheet components support cross-worksheet calculations, including:
For an in-depth analysis of features and price, visit our comparison of React spreadsheet components.
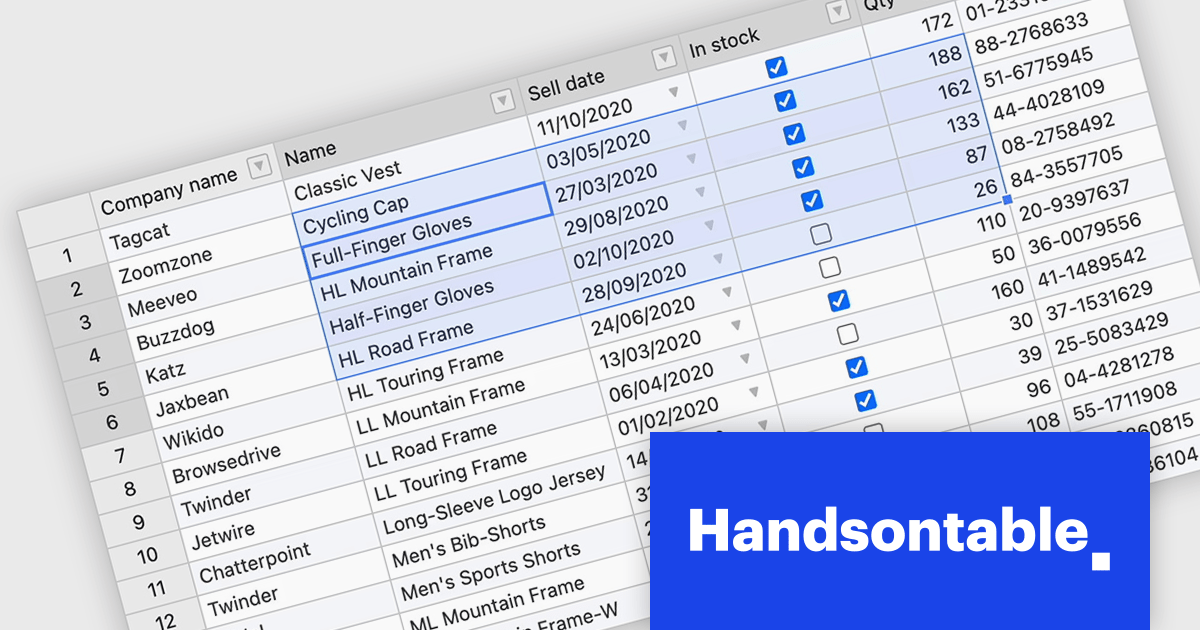
Handsontable is a JavaScript library designed to help developers build interactive data grids into their web applications. Offering a familiar spreadsheet-like interface, it allows users to edit, sort, and filter data with ease. Highly customizable and compatible with popular frameworks like React and Angular, Handsontable empowers developers to build robust data manipulation features into their web applications.
Handsontable 14.3 adds a new feature to streamline navigation within pre-selected cells. Power users and those accustomed to Tab navigation can now leverage arrow keys or the mouse for selection, then efficiently move between the chosen cells using Tab/Shift+Tab for horizontal movement and Enter/Shift+Enter for vertical movement. Editing remains intuitive, as typing any character initiates editing even within dropdown or date cells.
To see a full list of what's new in version 14.3.0, see our release notes.
Handsontable is licensed per developer and is available as an Annual or Perpetual license with 1 year support and maintenance. See our Handsontable licensing page for full details.
For more information, visit our Handsontable product page.


Tel.: (888) 850 9911
Fax: +1 770 250 6199


