


Offizieller Lieferant
Als offizieller und autorisierter Distributor beliefern wir Sie mit legitimen Lizenzen direkt von mehr als 200 Softwareherstellern.
Sehen Sie alle unsere Marken.
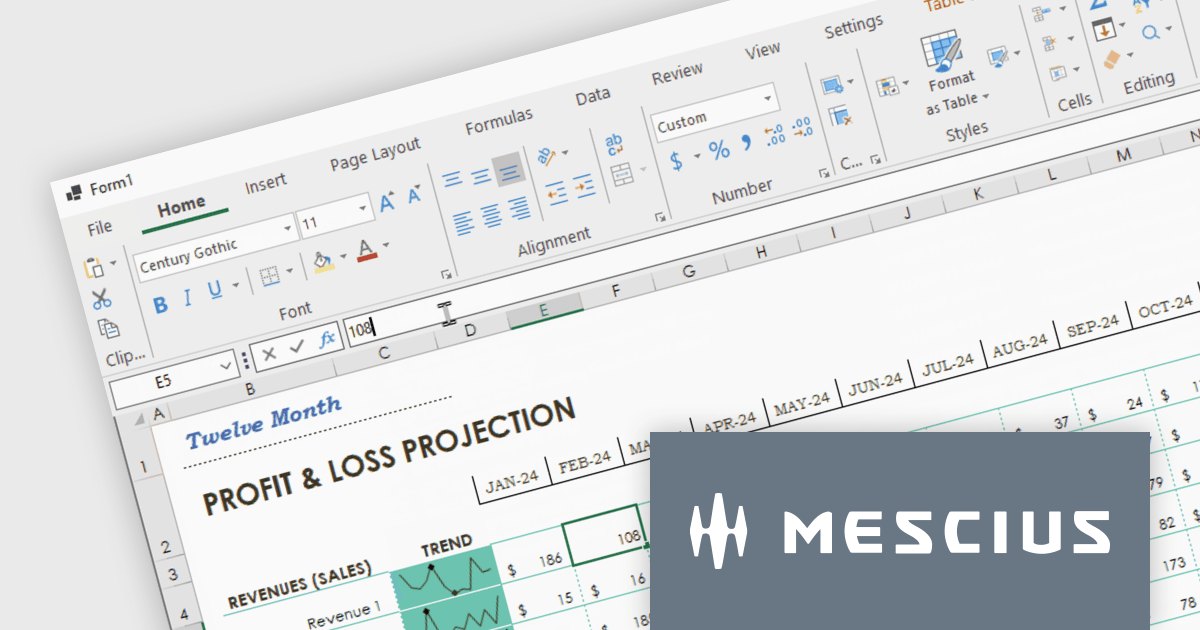
Spread.NET helps you create spreadsheets, grids, dashboards, and forms. It includes a powerful calculation engine with 450+ functions and the ability to import and export Excel spreadsheets. Leverage the extensive .NET spreadsheet API and powerful calculation engine to create analysis, budgeting, dashboard, data collection and management, scientific, and financial applications. You can develop in Visual Studio using VB or C# for WinForms, ASP.NET, and WPF. Spread.NET ensures maximum performance for your enterprise apps and its modular architecture lets you add only the features you need, reducing unnecessary bloat.
In this blog post, MESCIUS Product Marketing Specialist Mackenzie Albitz shows you how to add a spreadsheet ribbon bar control to a .NET 8 WinForms app using C#. Steps include:
Read the complete blog and unlock the powerful capabilities of the Spread.NET component.
Spread.NET is licensed per developer and is available as a Perpetual License with a 12 month support and maintenance subscription. We can supply any Spread.NET license including new licenses, maintenance renewals, and upgrade licenses. See our Spread.NET licensing page for full details.
For more information, visit our Spread.NET product page.
Telerik UI for WPF is an extensive UI library specifically designed for building modern and feature-rich business applications using the Windows Presentation Foundation (WPF) framework. It offers many customizable controls, ranging from data-driven grids and charts to specialized navigation and input components. The suite emphasizes performance and user experience, providing data virtualization for handling large datasets efficiently and ensuring visually appealing interactions.
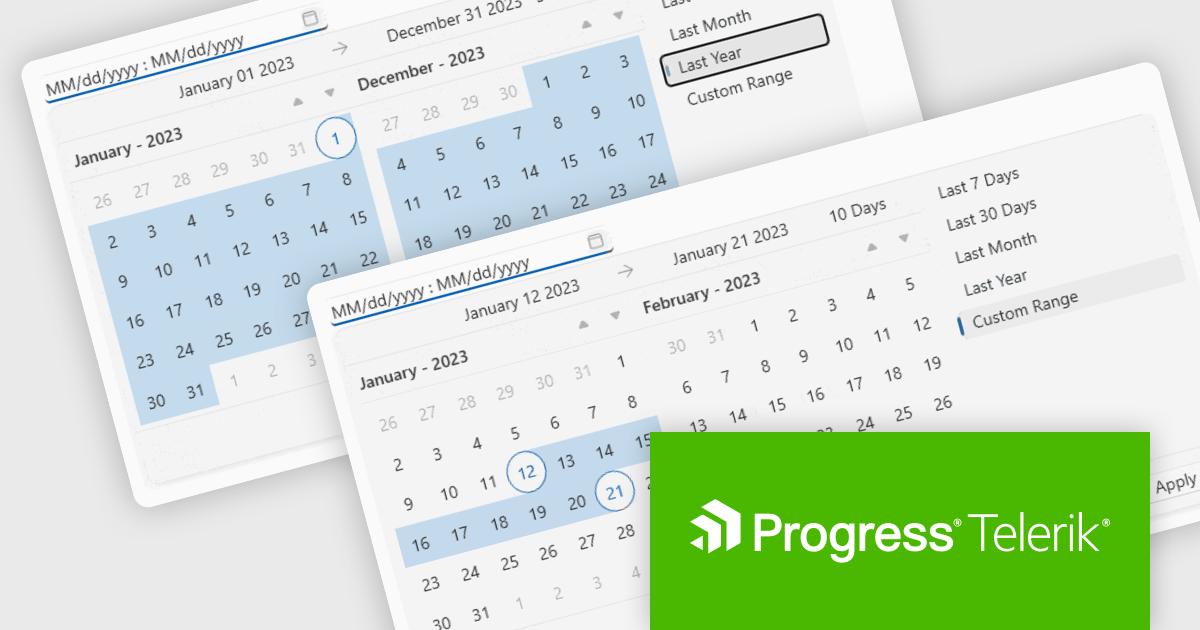
The Telerik UI for WPF 2024 Q1 update streamlines date selection in your WPF applications with a new DateRangePicker control. This intuitive scheduling component empowers users to effortlessly choose date intervals through interactive calendar popups. It supports pre-defined ranges like "Last Week" or "This Month", as well as custom selections. Developers gain further control with unselectable "blackout date" functionality and extensive customization options, simplifying user interaction and data filtering within their WPF applications.
To see a full list of what's new in 2024 Q1, see our release notes.
Telerik UI for WPF is licensed per developer and is available as a perpetual license with a one year support subscription, which is available in three tiers: Lite, Priority or Ultimate. See our Telerik UI for WPF licensing page for full details.
Telerik UI for WPF is available to buy in the following products:

Mail merge in reporting software is a feature that allows users to automatically generate letters, labels, and other documents by merging a template with data. This is typically used to create personalized documents in bulk, such as invoices, form letters, or address labels, saving time and reducing errors compared to manually entering information. Mail merge is widely used in marketing, customer service, and administrative tasks, making it a valuable asset for any organization sending bulk communications.
Several WPF Reporting controls provide Mail Merge functionality including:
For an in-depth analysis of features and price, visit our WPF Reporting Controls comparison.
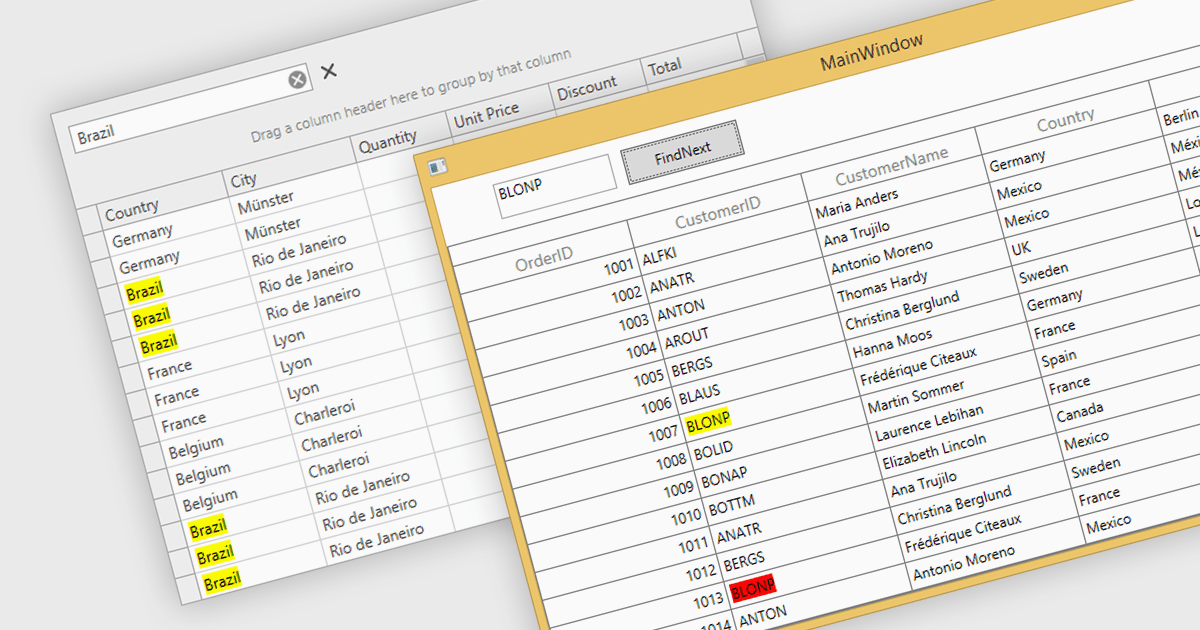
Searching within a grid enables users to quickly find specific data points by entering search criteria. For large datasets, navigating to specific data points can be a monumental task, often requiring time-consuming manual scrolling. Grid search allows users to pinpoint desired data within seconds, boosting productivity and streamlining analysis. This eliminates the need for tedious browsing and empowers users to quickly identify trends, patterns, and outliers, enabling deeper insights and informed decision-making.
Several WPF grids support searching including:
For an in-depth analysis of features and price, visit our WPF grids comparison.
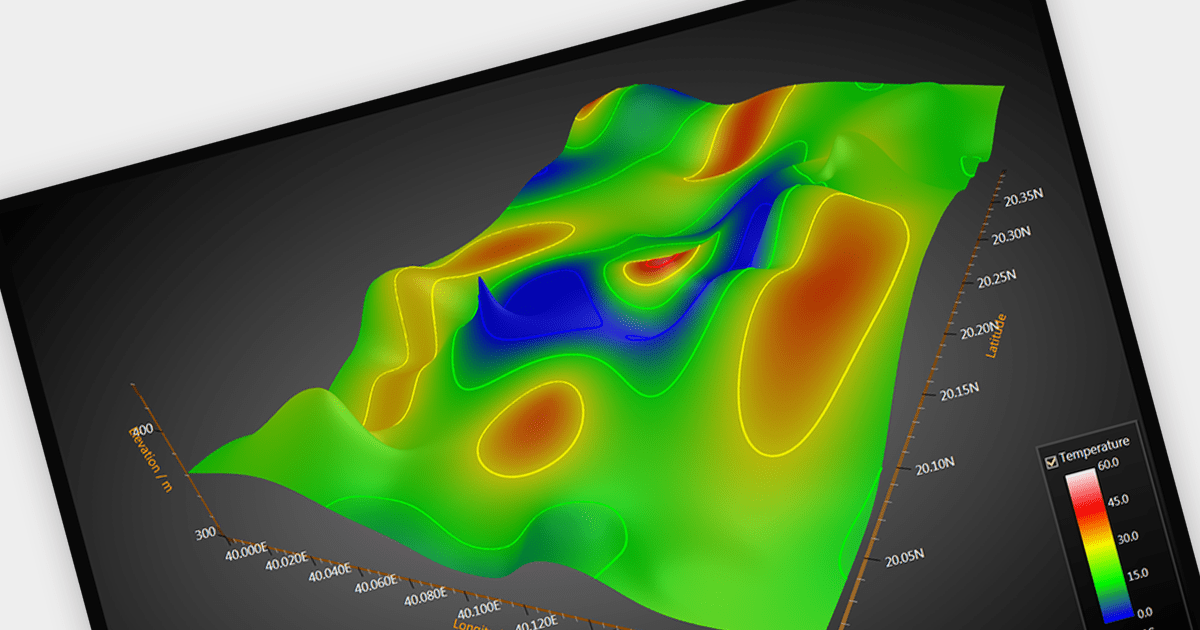
Surface charts are graphical representations that depict three-dimensional data in a two-dimensional format, typically using a grid of rows and columns. These charts provide a visual representation of how two independent variables (typically represented on the X and Y axes) influence a dependent variable, represented by the height or color of the surface. The primary benefit of surface charts lies in their ability to reveal complex relationships within datasets, making it easier for analysts and decision-makers to grasp patterns and trends. Surface charts offer a valuable tool for analyzing data in fields such as scientific research, engineering, finance, and various other domains.
Several WPF chart controls offer Surface charts including:
For an in-depth analysis of features and price, visit our WPF chart controls comparison.


Tel.: (888) 850 9911
Fax: +1 770 250 6199


