


Offizieller Lieferant
Als offizieller und autorisierter Distributor beliefern wir Sie mit legitimen Lizenzen direkt von mehr als 200 Softwareherstellern.
Sehen Sie alle unsere Marken.

DevExpress BI Dashboard (part of DevExpress Universal) empowers you to craft interactive dashboards for desktop, web and mobile applications. It provides a visual designer for building dashboards without writing code, allowing you to drag-and-drop various data visualization widgets onto the canvas. These widgets connect to your data sources and update dynamically, offering real-time insights to end users. The tool also supports customization through properties and events, enabling you to tailor the look and feel of the dashboards to perfectly integrate with your application's design.
The DevExpress BI Dashboard 24.1 release adds support for cascading parameters. This powerful feature allows you to create intuitive filter hierarchies within your dashboards. Imagine selecting a value in a parent parameter, then watching as the options in a dependent parameter automatically update to reflect the chosen filter. This eliminates the need for users to manually navigate through potentially overwhelming dropdown lists, fostering a more focused and efficient experience. Cascading parameters empower you to design dashboards that guide users towards deeper insights within your data.
To see a full list of what's new in version 24.1, see our release notes.
DevExpress BI Dashboard is included as part of DevExpress Universal which is licensed per developer and is available as a Perpetual License with a 12 month support and maintenance subscription. See our DevExpress Universal licensing page for full details.
DevExpress BI Dashboard is available in the following products:
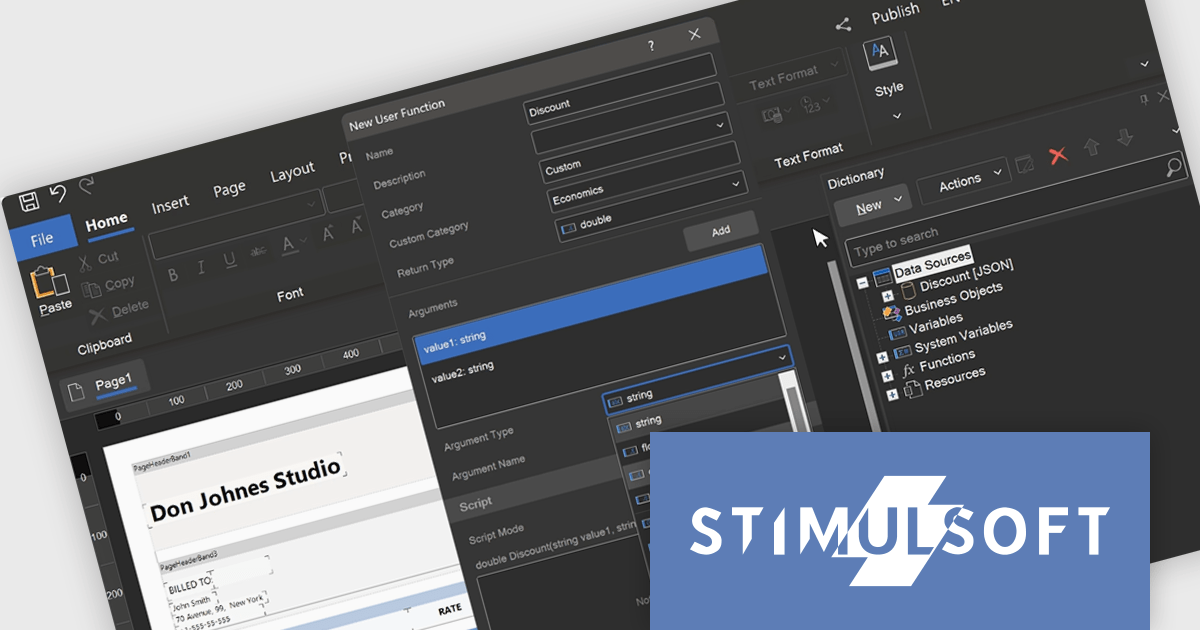
Stimulsoft Reports.WEB is a cross-platform reporting solution designed for integration within web applications. It leverages a client-server architecture for report generation, viewing, printing, and exporting directly in web browsers. Its powerful .NET report engine offers efficient report processing, a user-friendly HTML5 report designer for building reports with various data sources and visualizations, and an interactive HTML5 viewer for seamless report display within web applications. This integration allows developers to implement robust reporting functionalities without browser plugins or additional client-side dependencies.
The Stimulsoft Reports.WEB 2024.3 release empowers developers with user-defined functions within the data dictionary. This functionality extends report capabilities by allowing creation of custom logic using either the visual programming tool Blockly or directly in supported scripting languages. These user-defined functions can be seamlessly integrated into reports enabling developers to address complex calculations, data transformations, or custom formatting logic without code modifications in the main application. This streamlines development, promotes code reusability, and fosters a more dynamic reporting environment.
To see a full list of what's new in version 2024.3, see our release notes.
Stimulsoft Reports.WEB is licensed per developer and is available as a Perpetual license with 1 year support and maintenance. See our Stimulsoft Reports.WEB licensing page for full details.
Stimulsoft Reports.WEB is available in the following products:
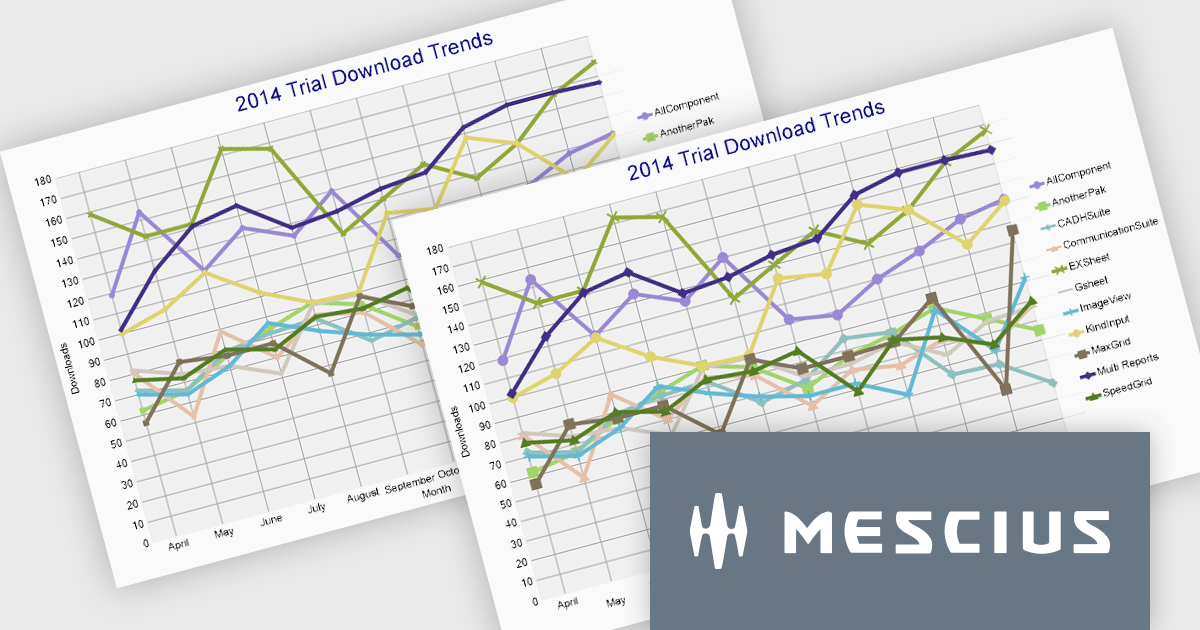
ActiveReports.NET from MESCIUS (formerly GrapeCity) is a comprehensive reporting solution for developers building applications in the .NET framework. It empowers you to design and deliver visually appealing reports through user-friendly designers and a wide range of controls. ActiveReports simplifies report creation and distribution with a versatile API, rich data source connectivity, and support for multiple export formats. This translates to increased developer productivity and improved end-user experience with powerful reporting functionalities within your .NET applications.
The ActiveReports.NET 18.1 update adds additional attributes to improve the customization and visual representation of charts in RDLX, Page, and Dashboard reports. The new LabelRowCount property, applies to the X-axis of charts and allows you to choose the number of rows for axis labels, enabling multi-row layouts for improved label display and organization. The new SymbolSize property allows you to change the size of plot symbols, giving you more control over chart data presentation. It is compatible with the following chart types: Line chart, Radar line chart, Radar scatter chart, Radar bubble chart, Scatter chart, and Bubble chart. These modifications are intended to improve the clarity and adaptability of chart displays within your .NET Report applications.
To see a full list of what's new in 18.1, see our release notes.
ActiveReports.NET is licensed per developer and is available with or without a 12 month support and maintenance subscription. See our ActiveReports.NET licensing page for full details.
Learn more on our ActiveReports.NET product page.
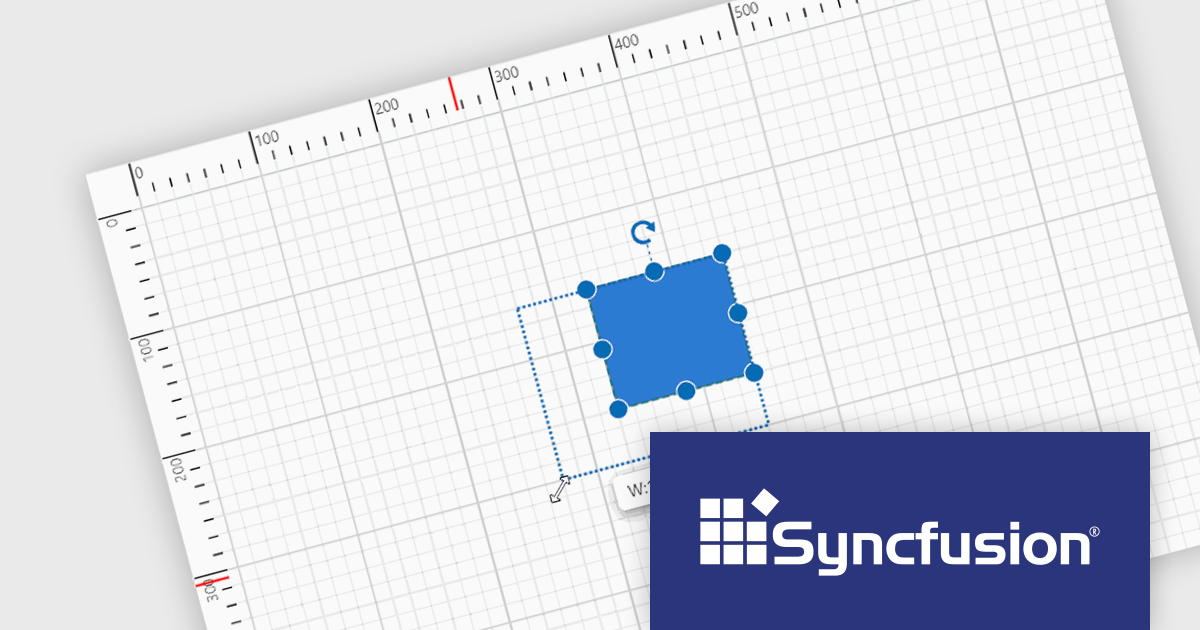
Syncfusion Essential Studio Blazor (available as part of Syncfusion Essential Studio Enterprise) is a comprehensive UI component library designed to accelerate the development of high-performance, modern web applications using the Blazor framework. It boasts over 85+ responsive, lightweight, and modular components spanning various categories such as data visualization, data editing, document processing, and interactive UI elements. This rich repertoire empowers developers to rapidly build user-friendly, feature-rich web interfaces, with seamless integration of both server-side and client-side Blazor applications.
The Syncfusion Essential Studio Blazor 2024 Volume 2 (26.1.35) release introduces a ruler for the Diagram component, enhancing precision and simplifying element arrangement. This ruler provides both horizontal and vertical guides, allowing for visual measurement of object dimensions, indication of element positions, and alignment of various components. This significantly streamlines the creation of accurate and well-proportioned diagrams, particularly for tasks like crafting scale models.
To see a full list of what's new in 2024 Volume 2 (26.1.35), see our release notes.
Syncfusion Essential Studio Blazor is available as part of Syncfusion Essential Studio Enterprise which is licensed per developer starting with a Team License of up to five developers. It is available as a 12 Month Timed Subscription License which includes support and maintenance. See our Syncfusion Essential Studio Enterprise licensing page for full details.
Learn more on our Syncfusion Essential Studio Blazor product page.
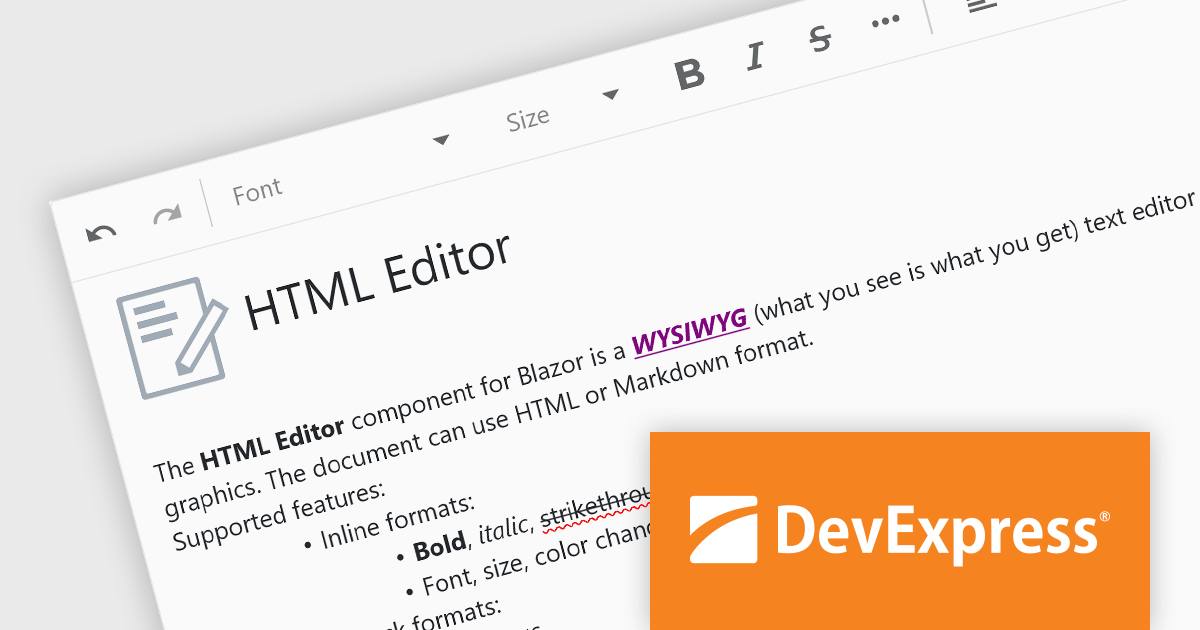
DevExpress Blazor (part of DevExpress ASP.NET and Blazor) helps you create high-impact user experiences for both Blazor Server and Blazor WebAssembly using C#. The Blazor UI Component Library ships with a comprehensive set of native components (including a DataGrid, Pivot Grid, Scheduler, Chart, Data Editors and Reporting).
The DevExpress Blazor 24.1 release adds an all-new HTML Editor. This intuitive tool empowers users to craft visually appealing and informative content with ease. Go beyond plain text by incorporating formatting options like bold, italics, and headings. Fine-tune the look and feel of your content by adjusting font styles, sizes, and colors to match your brand identity. It offers the flexibility to store your creations in either HTML or Markdown format, catering to different needs and workflows. This level of control and versatility makes the Blazor HTML Editor a perfect fit for anyone looking to elevate their content creation experience.
To see a full list of what's new in version 24.1, see our release notes.
DevExpress ASP.NET and Blazor is licensed per developer and is available as a Perpetual License with a 12 month support and maintenance subscription. See our DevExpress ASP.NET and Blazor licensing page for full details.
DevExpress Blazor is available in the following products:


Tel.: (888) 850 9911
Fax: +1 770 250 6199


