


Offizieller Lieferant
Als offizieller und autorisierter Distributor beliefern wir Sie mit legitimen Lizenzen direkt von mehr als 200 Softwareherstellern.
Sehen Sie alle unsere Marken.
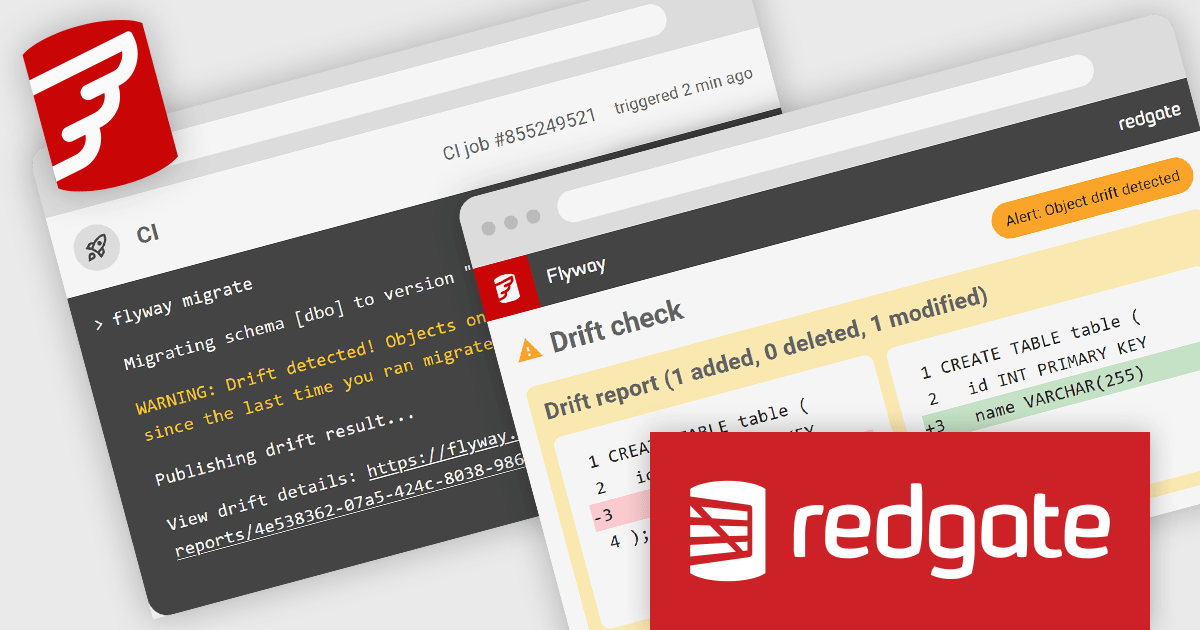
Redgate Software is a leading provider of database development and deployment solutions designed to simplify and enhance database management for organizations of all sizes. With a focus on simplifying complex workflows, Redgate delivers tools that ensure consistency, control, and visibility across database environments. Key features include comprehensive change tracking, deployment automation, and detailed audit logs to maintain compliance and accountability. These capabilities enable teams to prevent errors, improve collaboration, and ensure the reliability of database systems in fast-paced industries like finance, healthcare, and technology. By integrating seamlessly into existing workflows, Redgate supports businesses in achieving their goals with efficiency, security, and confidence.
Flyway Pipelines provides a powerful drift check feature that enhances database deployment workflows by ensuring consistency and control. This enables software developers to detect unauthorized or out-of-process schema changes early in the pipeline, reducing risks associated with unexpected modifications. By providing detailed object-level change reports, the drift check allows teams to understand what has changed, why it matters, and how to resolve discrepancies efficiently. This fosters greater accountability, streamlines debugging, and helps maintain the integrity of deployments across development, staging, and production environments, ultimately supporting more reliable and predictable database operations.
Flyway is licensed per user, per year and is available as a commercial annual subscription license for Teams or Enterprises. See our Flyway licensing page for full details.
For more information, visit our Flyway product page.
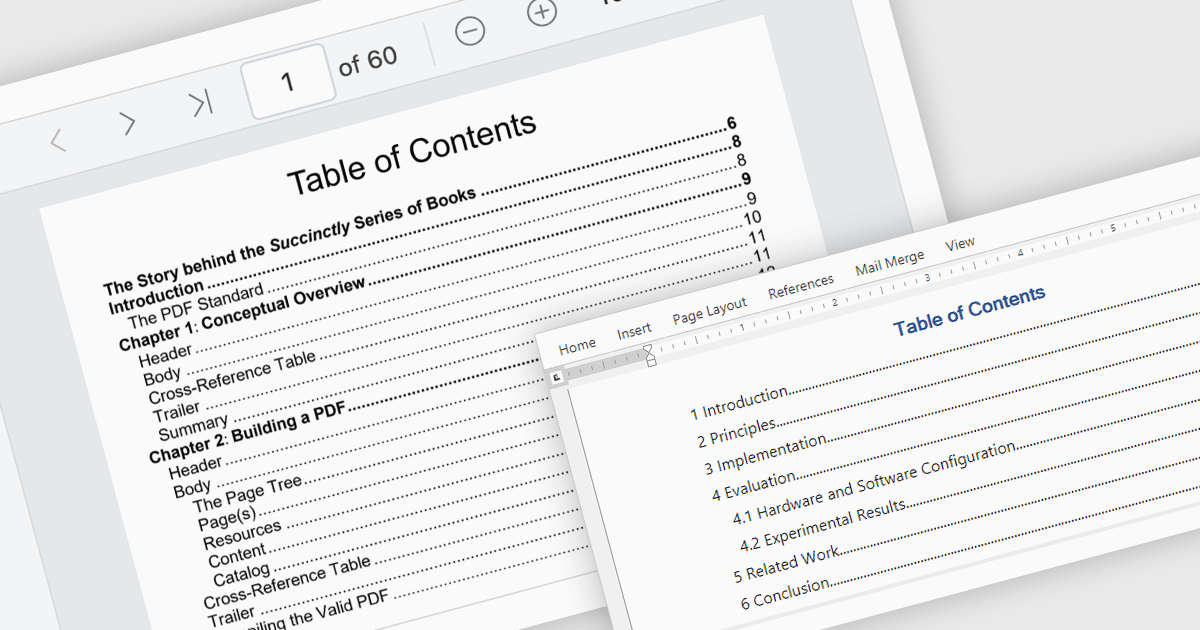
A table of contents is a powerful navigation tool that provides users with a structured overview of a document's hierarchy, allowing them to jump directly to specific sections with a single click. This feature significantly enhances the user experience, saving time when dealing with lengthy or complex documents. For developers, integrating a table of contents into applications ensures better usability and accessibility, making it a key feature in professional document management solutions. Common use cases include navigating through extensive eBooks, technical manuals, legal documents, financial reports, or any file with a well-defined structure. By streamlining document exploration, a table of contents boosts productivity and ensures seamless interaction with large-scale content.
Several .NET PDF viewer components offer Table of Contents Navigation support including:
For an in-depth analysis of features and price, visit our .NET PDF viewer comparison.

Undo and redo functionality in a spreadsheet allows users to reverse or reapply actions made during editing, providing a straightforward way to correct mistakes or recover changes. The undo option enables users to step back through recent actions, such as data entry, formatting, or formula adjustments, while redo restores any actions reversed by the undo function. This capability provides a safety net, allowing users to recover from unintended modifications, thereby enhancing productivity as it minimizes errors and streamlines the editing process.
Several WPF spreadsheet components allow you to redo and undo editing changes, including:
For an in-depth analysis of features and price, visit our WPF spreadsheet controls comparison.
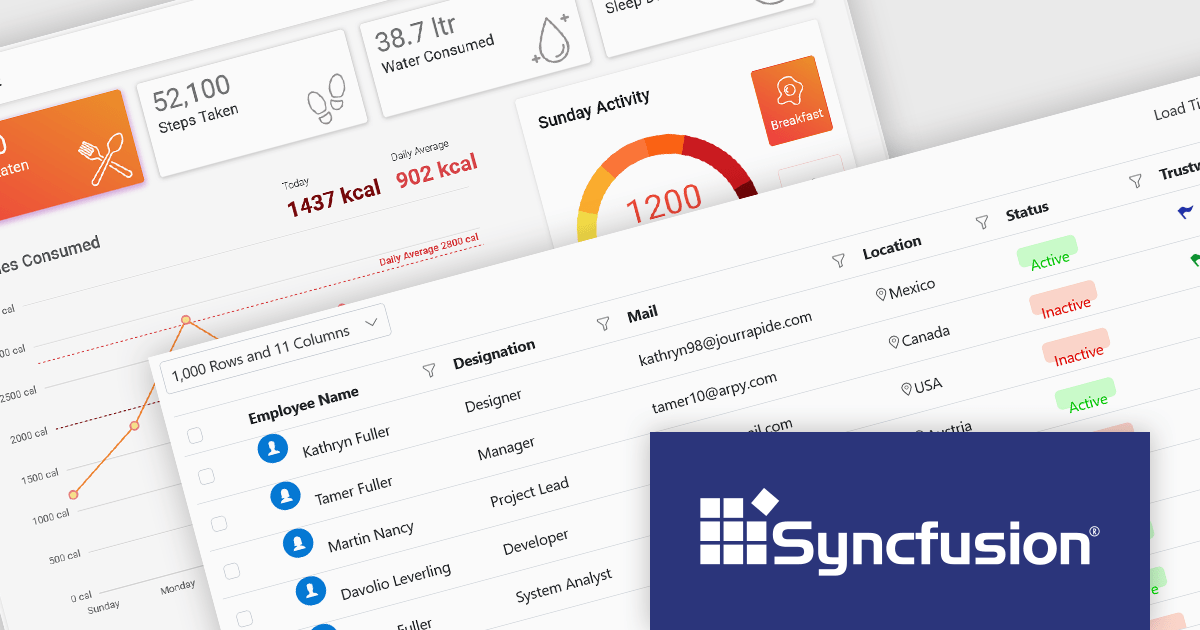
Syncfusion Essential Studio Enterprise provides a comprehensive collection of UI components and frameworks for building modern cross-platform applications. It offers over 1,800 components compatible with .NET WinForms, WPF, ASP.NET Core & MVC, WinUI, MAUI, JavaScript, Xamarin, Blazor, and more, enabling seamless application development across diverse devices and operating systems.
The Syncfusion Essential Studio Enterprise 2024 Volume 3 SP1 (27.2.2) release introduces full support for .NET 9, allowing developers to target the latest version of Microsoft's popular framework, and benefit from performance and security improvements. Syncfusion products for all supported .NET platforms, including .NET MAUI, ASP.NET Core, Blazor, Windows Forms, and WPF, are now compatible with Microsoft .NET 9.
To see a full list of what's new in 2024 Volume 3 SP1 (27.2.2), see our release notes.
Syncfusion Essential Studio Enterprise is licensed per developer starting with a Team License of up to five developers. It is available as a 12 Month Timed Subscription License which includes support and maintenance. See our Syncfusion Essential Studio Enterprise licensing page for further details.
Learn more on our Syncfusion Essential Studio Enterprise product page.
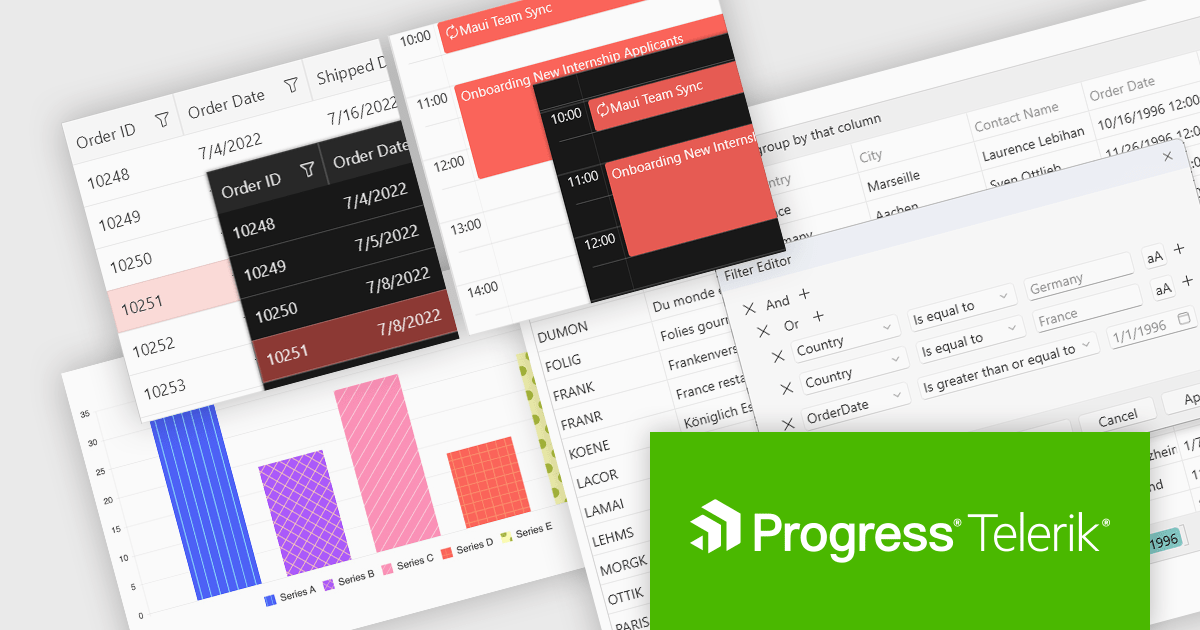
Progress Telerik is a leading provider of UI components, reporting software, and developer productivity tools. Its core Telerik UI product range provides a comprehensive set of libraries for building modern, high-performance and feature-rich applications. These suites are meticulously designed to integrate seamlessly with .NET and facilitate rapid development across such platforms as ASP.NET Core/MVC/AJAX, Blazor, .NET MAUI, WPF, and WinForms.
The Telerik 2024 Q4 releases add full compatibility with Microsoft .NET 9, providing developers with access to the latest features and enhancements in the .NET ecosystem. With day-zero support, developers can leverage the fine-tuned .NET 9 runtime for substantial performance gains, alongside better compression and caching in Blazor and an improved Blazor Server reconnection experience. It also brings increased platform and tooling stability, native library embeddings for .NET MAUI, and a new .NET MAUI Blazor Hybrid and Web app solution template to streamline hybrid app creation. With many other enhancements, .NET 9 and Telerik can provide a unified development experience, enabling faster app performance, superior user experiences, and access to the latest innovations in modern development, including AI integrations and advanced developer tooling.
Support for .NET 9 is available across the Telerik .NET product range:
For more information about what's new in 2024 Q4, see our release notes.
Telerik products are primarily licensed per developer and are available as perpetual licenses with a one year support subscription, which comes in three tiers: Lite, Priority or Ultimate. See our Telerik DevCraft Ultimate licensing page for full details.


Tel.: (888) 850 9911
Fax: +1 770 250 6199


