


Offizieller Lieferant
Als offizieller und autorisierter Distributor beliefern wir Sie mit legitimen Lizenzen direkt von mehr als 200 Softwareherstellern.
Sehen Sie alle unsere Marken.
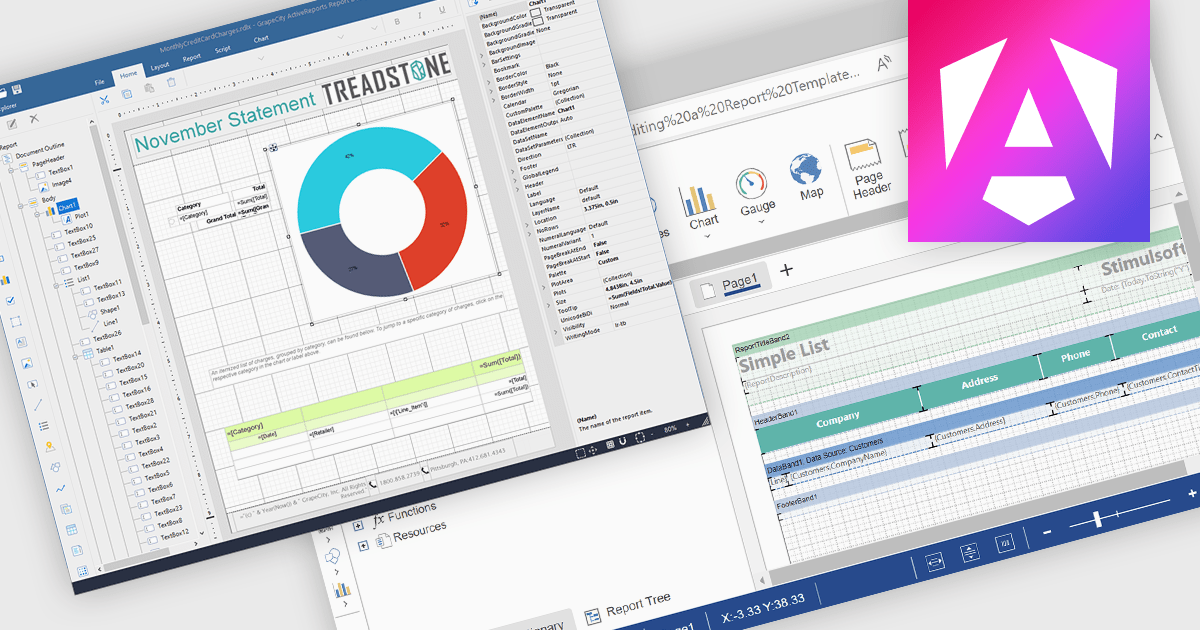
A Visual Report Designer in a reporting control enables users to create and customize data-rich reports through an intuitive, drag-and-drop interface. With ready-to-use templates, interactive elements, and direct data binding, it simplifies report creation while maintaining professional quality. Key benefits include real-time data updates, brand customization, and interactive filters, making it ideal for business intelligence tasks like financial dashboards, performance reports, and analytics summaries. This feature empowers teams to generate insights quickly and make data-driven decisions with ease.
Several Angular reporting controls offer visual report designer support including:
For an in-depth analysis of features and price, visit our Angular Reporting Controls comparison.

To better align with the evolving landscape of reporting technologies, Fast Reports will cease updates and support for FastReport.Web (.NET Framework) on December 1st. While this library has been invaluable for numerous Online Designer projects, FastReports' future efforts will concentrate on more modern technologies. From this date, the FastReport.Web (Legacy) library will no longer receive bug fixes or technical support.
Fast Reports currently supports four web reporting solutions:
You can still create an Online Designer for FastReport.Web (Legacy), but Fast Reports recommends migrating to the new backend for an improved user experience.
FastReport .NET includes both backends, so no further purchase is necessary. To migrate to FastReport.Web for Core/Blazor, you will need to build an Online Designer with the updated FastReport.Web or FastReport.Web.Skia backend.
FastReport .NET is licensed per named user with options for Single, Team or Site Licenses. See our FastReport .NET licensing page for full details.
For more information, visit our FastReport .NET product page.
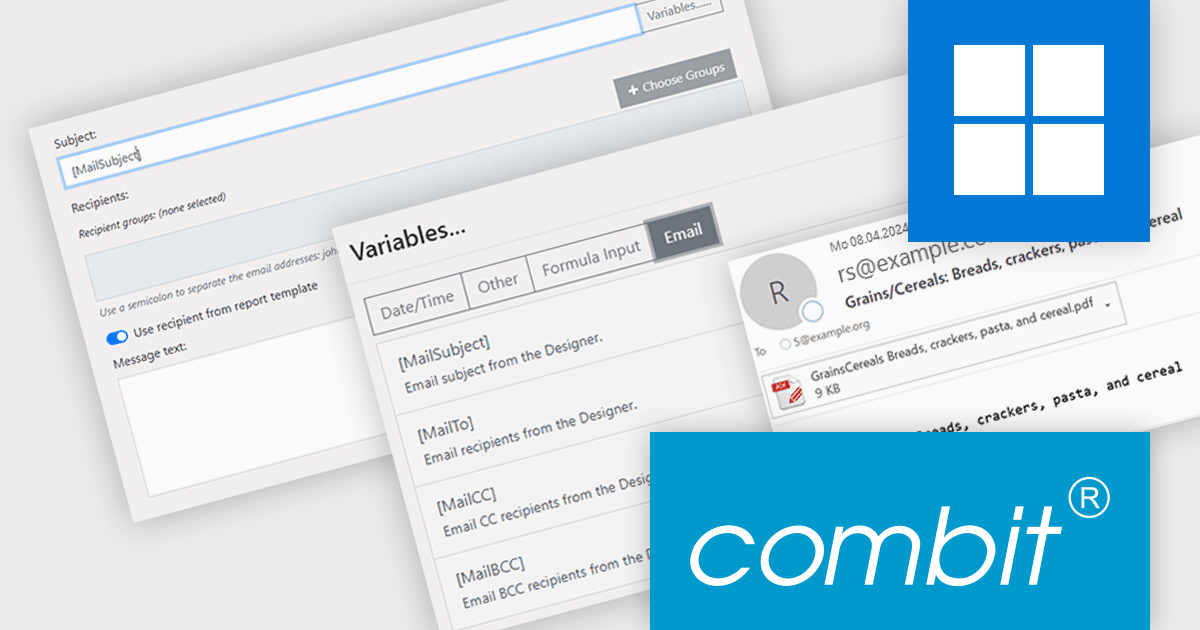
combit Report Server (included as part of List & Label Enterprise Reporting Edition) is a versatile BI reporting solution which can be used standalone or integrated into your List & Label applications. It can be customized to match your corporate design and enables platform-agnostic report generation, scheduling, and exporting from a variety of data sources in multiple formats and languages.
The combit Report Server version 30 update introduces a new "email per record" function that enhances report distribution. This grants developers the ability to automatically generate and send individual emails for each data record in a report. By eliminating the need for manual email creation and sending for large datasets, developers can save time and resources while ensuring timely and accurate delivery of information. This capability is particularly useful in scenarios with high data variability, such as invoicing, order processing, or customer notifications, where each recipient needs different information from the same report.
To see a full list of what’s new in version 30, see our release notes.
combit Report Server is licensed as part of List & Label Enterprise Edition. List & Label is licensed per developer and is available as a Perpetual License with a 12 month support and maintenance subscription. See our combit Report Server licensing page for full details.
Report Server is available to buy in the following products:
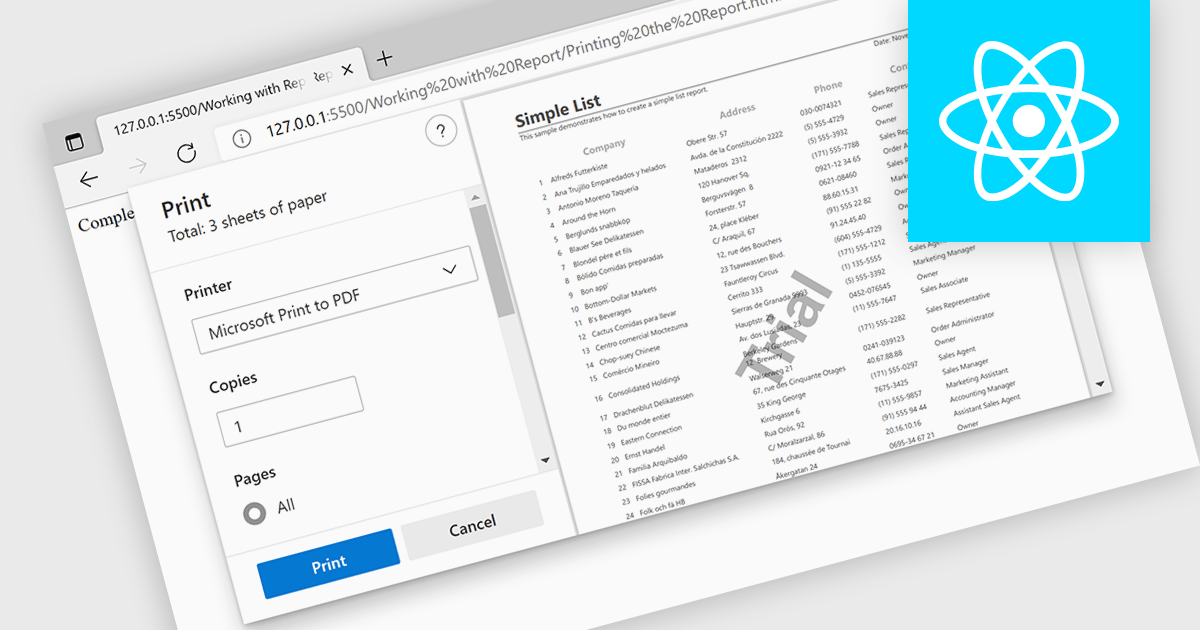
Printing functionality in reporting controls allows users to generate physical or digital copies of reports directly from within the software, ensuring seamless access to formatted, ready-to-distribute documents. This capability is especially valuable in data-driven applications where users need to share insights in a standardized format, such as in financial, operational, or compliance reporting. With printing support, users can define how reports appear on paper or in PDF format, often choosing custom layouts, page sizes, or specific sections for export, all of which aid in producing polished and accessible presentations of data. By reducing the manual steps needed to prepare data for distribution, printing functionality helps streamline workflows and enhance the utility of reporting tools for both internal and external stakeholders.
Several React reporting controls offer printing support including:
For an in-depth analysis of features and price, visit our React Reporting controls comparison.

Stimulsoft Reports.NET is a reporting tool that empowers developers to design, edit, view, export, and print reports of varying complexity. It features a user-friendly report designer and an interactive viewer, allowing connection to various data sources. The generated reports can be seamlessly integrated into both Windows Forms and ASP.NET applications, with export capabilities to numerous formats for maximum flexibility.
The Stimulsoft Reports.NET 2024.4.1 release introduces a new Export Settings property, allowing export configurations to be set directly within the report template. This enhancement removes the need for separate export setup steps, ensuring consistent application of export settings each time the report is generated. By embedding export settings within the template, the report definition becomes entirely self-contained, improving portability and streamlining report management.
To see a full list of what's new in 2024.4.1, see our release notes.
Stimulsoft Reports.NET is licensed per developer and is available as a perpetual license with 1 year support and maintenance. See our Stimulsoft Reports.NET licensing page for full details.
Stimulsoft Reports.NET is available in the following products:


Tel.: (888) 850 9911
Fax: +1 770 250 6199


