


Offizieller Lieferant
Als offizieller und autorisierter Distributor beliefern wir Sie mit legitimen Lizenzen direkt von mehr als 200 Softwareherstellern.
Sehen Sie alle unsere Marken.
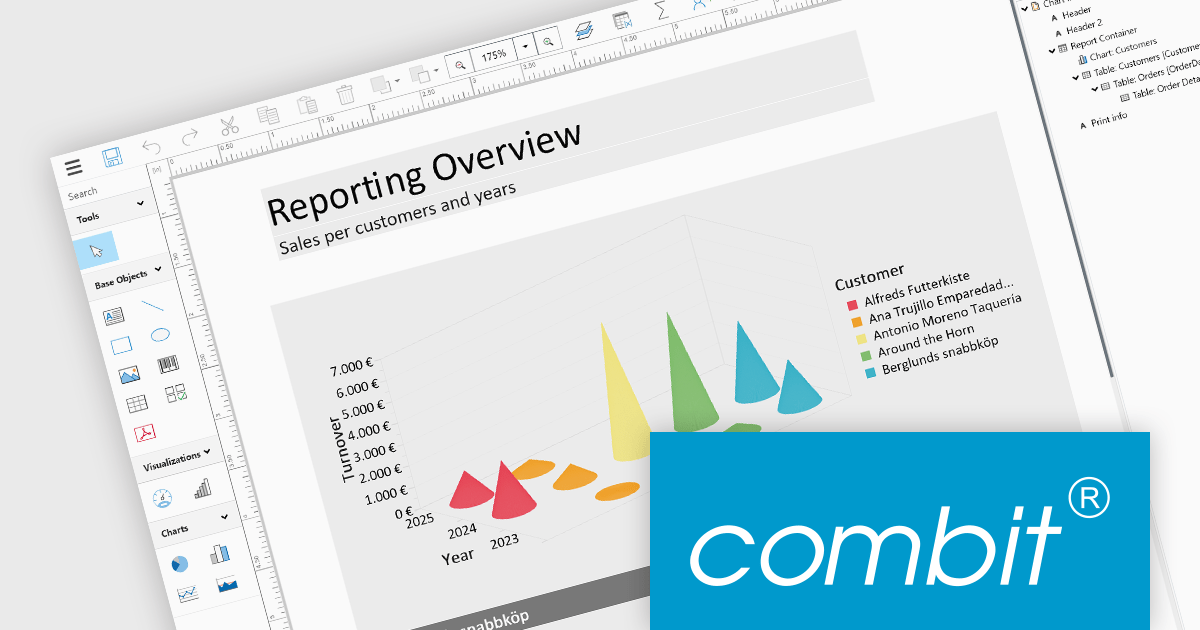
List & Label by combit is a software development toolkit that empowers developers to integrate comprehensive reporting functionalities into their desktop, web, and cloud applications. It offers features such as data binding, complex data visualization, and a user-friendly report designer, along with printing, exporting, and previewing capabilities. List & Label operates independently of programming languages and data sources, providing developers with the flexibility to design and deliver informative reports within their development environment.
The List & Label 29.003 service pack introduces multiple caching mechanisms to optimize performance during operations involving large data structures within the Web Designer. With these mechanisms, the system significantly reduces the frequency of resource-intensive web server requests, thereby decreasing the load on the server. This approach optimizes resource utilization by storing frequently accessed data in temporary storage, thus decreasing the need for repeated data retrieval from the server. The result is faster data processing and improved response times, which is especially beneficial when handling complex design scenarios that demand extensive data processing.
To see a full list of what's new in 29.003, see our release notes.
List & Label is licensed per developer and is available as a Perpetual License with a 12 month support and maintenance subscription. See our List & Label licensing page for full details.
List & Label is available in the following products:
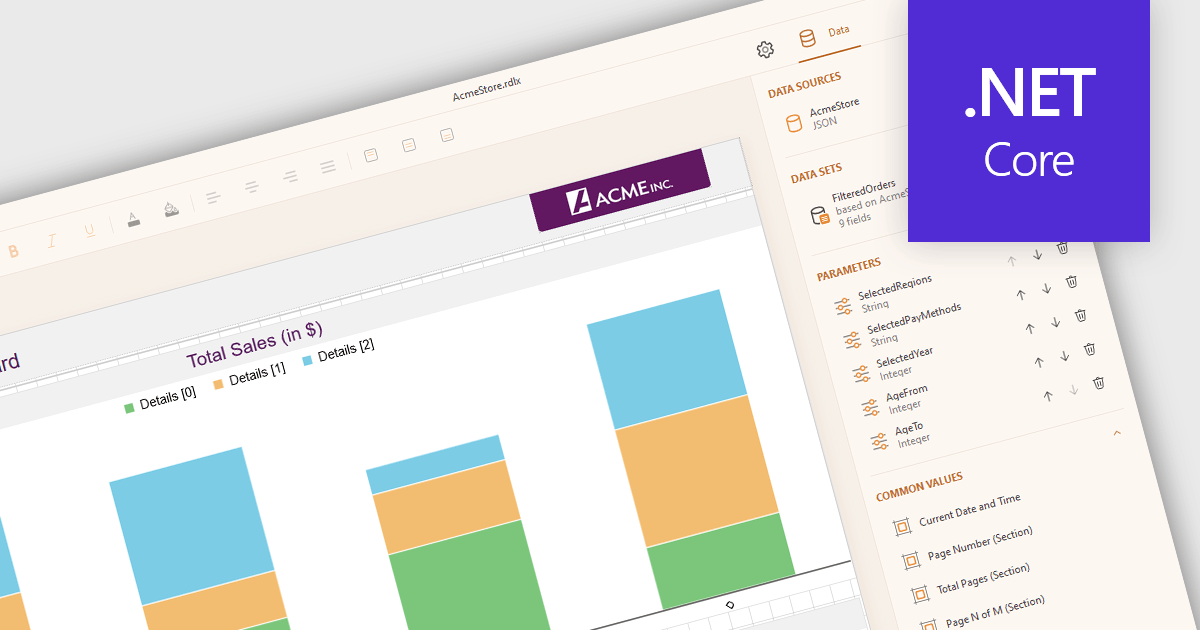
JSON data connectivity in reporting controls enables seamless integration of dynamic, human-readable data into reports. By directly connecting to JSON data sources, developers can leverage the format's flexibility, ease of use, and ability to handle diverse data structures. This empowers creation of adaptable reports that can quickly consume and visualize data from various sources, such as APIs, databases, or cloud services. Real-time reporting and interactive dashboards become feasible as JSON's structure aligns well with modern data consumption patterns. Use cases include operational reporting, data exploration, and business intelligence applications where agile data integration is paramount.
Several .NET Core reporting controls offer JSON data connectivity including:
For an in-depth analysis of features and price, visit our .NET Core reporting controls comparison.
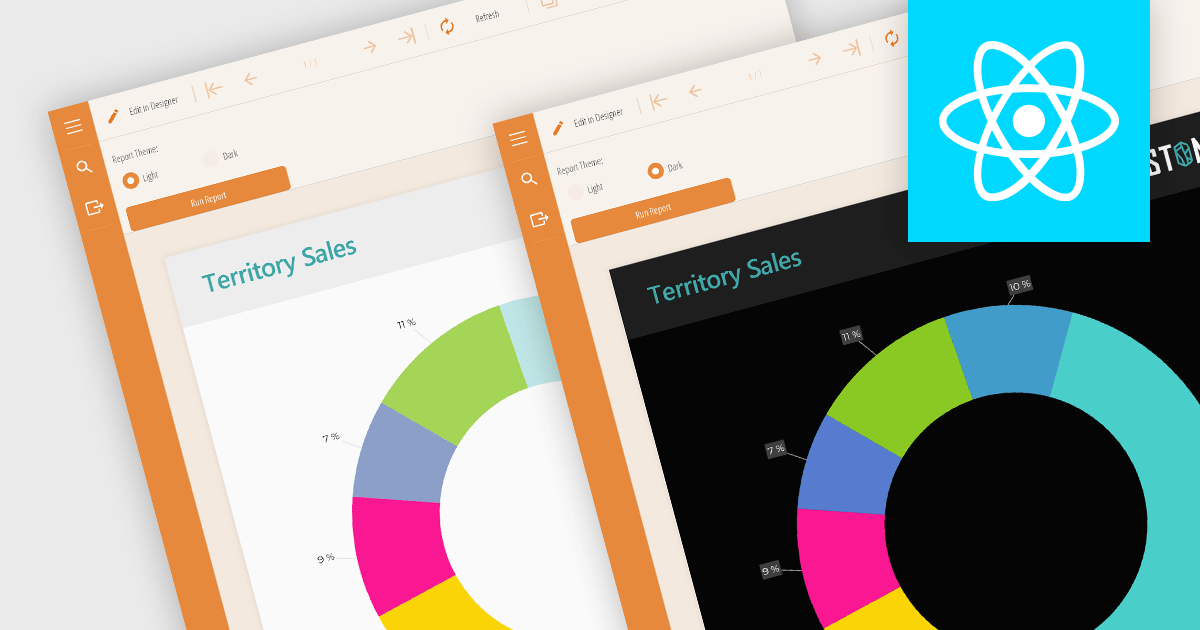
Reporting component themes provide a consistent visual style and branding across complex data visualizations. By offering pre-defined color palettes, typography, and layout options, themes streamline the design process and ensure reports align with overall application aesthetics. They enable rapid customization, allowing developers to create multiple themes for different report types or user preferences. Additionally, themes enhance user experience by improving readability and data perception, making complex information easier to understand. Use cases include creating branded reports, adapting to different screen sizes, and matching the look and feel of existing applications.
Several React reporting controls offer support for themes including:
For an in-depth analysis of features and price, visit our React reporting controls comparison.
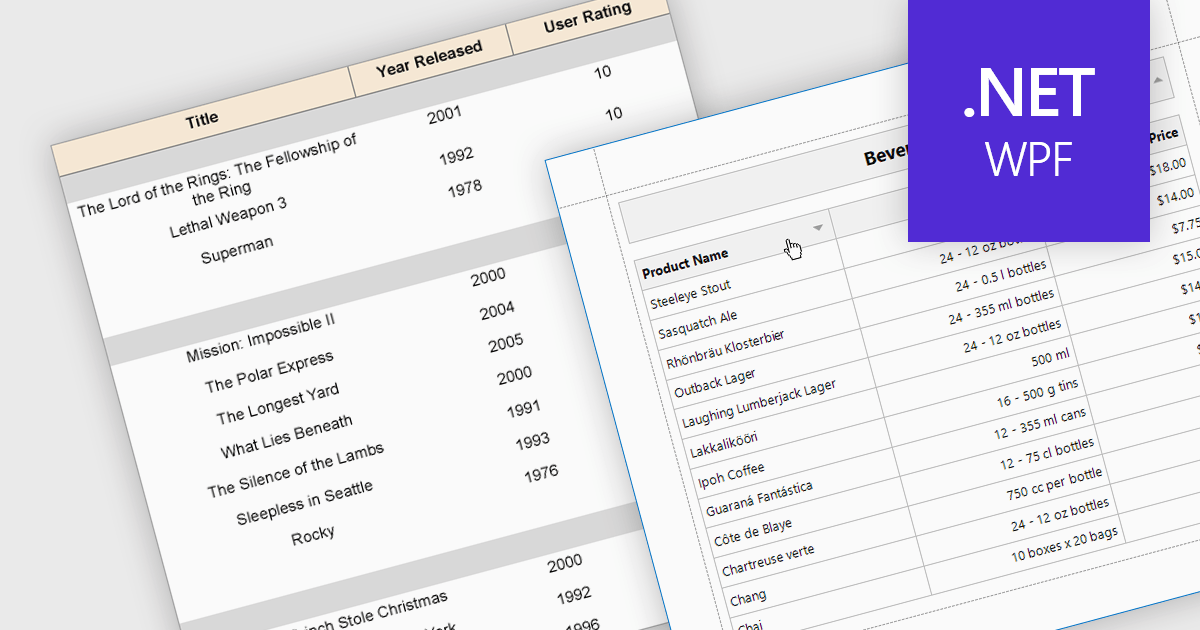
Effective reporting components benefit greatly from robust sorting functionality. This allows users to quickly organize data by any relevant column, facilitating identification of trends, outliers, and specific values. Sorting is particularly valuable for large datasets, enabling users to prioritize high-value information and tailor reports to their specific needs. This improves data exploration efficiency and user satisfaction within the reporting tool.
Several WPF reporting components support data sorting, including:
For an in-depth analysis of features and price, visit our WPF reporting components comparison.
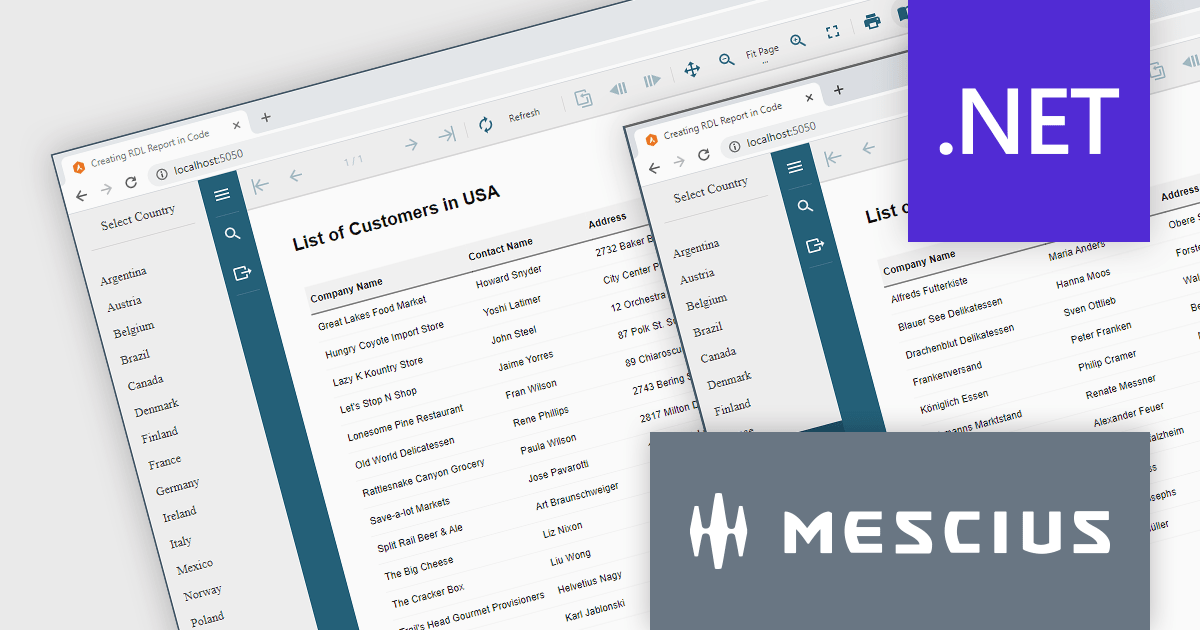
ActiveReports.NET helps you deliver beautiful reports with intuitive Visual Studio integrated report designers and rich controls. It provides code-based cross-platform reporting, easy-to-use designers, and a flexible API. Available for desktop (WinForms, WPF, .NET) and web (JavaScript, Blazor, ASP.NET MVC). Design and deliver powerful reports with intuitive, reliable, and user-friendly report designers and controls. It supports multiple report types, including RDL Reports.
Report Definition Language (RDL) defines a common schema that enables the interchange of report definitions. There are instances where it becomes necessary to programmatically generate an RDL report in your code, manage data binding conditionally at runtime, or modify the layout of a report based on user input. In this blog post, MESCIUS Product Manager Alec Gall guides you through the procedures required for using ActiveReports.NET to create an RDL report exclusively using C# code. Steps include:
Read the complete blog and learn how to leverage this powerful and flexible method for generating dynamic reports using ActiveReports.
ActiveReports.NET is licensed per developer and is available with or without a 12 month support and maintenance subscription. See our ActiveReports.NET licensing page for full details.
Learn more on our ActiveReports.NET product page.


Tel.: (888) 850 9911
Fax: +1 770 250 6199


