


Offizieller Lieferant
Als offizieller und autorisierter Distributor beliefern wir Sie mit legitimen Lizenzen direkt von mehr als 200 Softwareherstellern.
Sehen Sie alle unsere Marken.
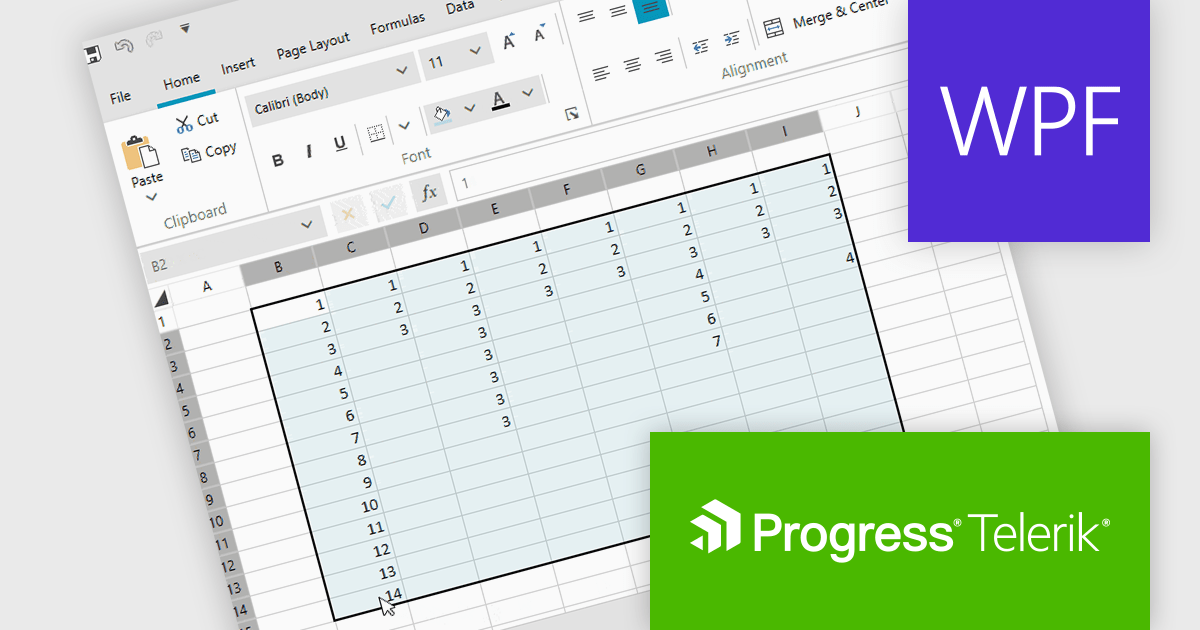
Telerik UI for WPF is a comprehensive suite of over 150 user interface components designed for Windows Presentation Foundation, enabling developers to build modern, high-performance desktop applications. It includes controls like data grids, charts, schedulers, and editors, optimized for seamless integration and support for MVVM (Model-View-View-Model) patterns. With features like built-in theming, responsive layouts, and customizable styling, it simplifies the creation of visually appealing, intuitive interfaces. Ideal for enterprise-grade or consumer-facing apps, Telerik UI for WPF accelerates development while ensuring professional-quality results.
Telerik UI for WPF now supports a 'CurrentRegion' selection property and corresponding UI command in its Spreadsheet control, enabling quick selection of adjacent, non-empty cells around the active cell. This feature replicates Microsoft Excel’s behavior, making it easier to apply formulas, format ranges, or export grouped data without manually selecting each cell. By automatically identifying relevant data regions, it enhances efficiency and creates a smoother, more intuitive user experience.
Telerik UI for WPF is licensed per developer and has two licensing models: an annual Subscription License and a Perpetual License. The Subscription license provides access to the latest product updates, technical support, and exclusive benefits for a flat annual fee, and must be renewed to continue using the software. The Perpetual license is a one-time purchase granting access to the current released version and includes a one-year subscription for product updates and technical support. After this initial period, users can choose to renew the subscription element to continue receiving updates and support; otherwise, they may continue using the installed version available during their active subscription term but will forgo future updates and support. See our Telerik UI for WPF licensing page for full details.
Telerik UI for WPF is available individually or as part of the following products:
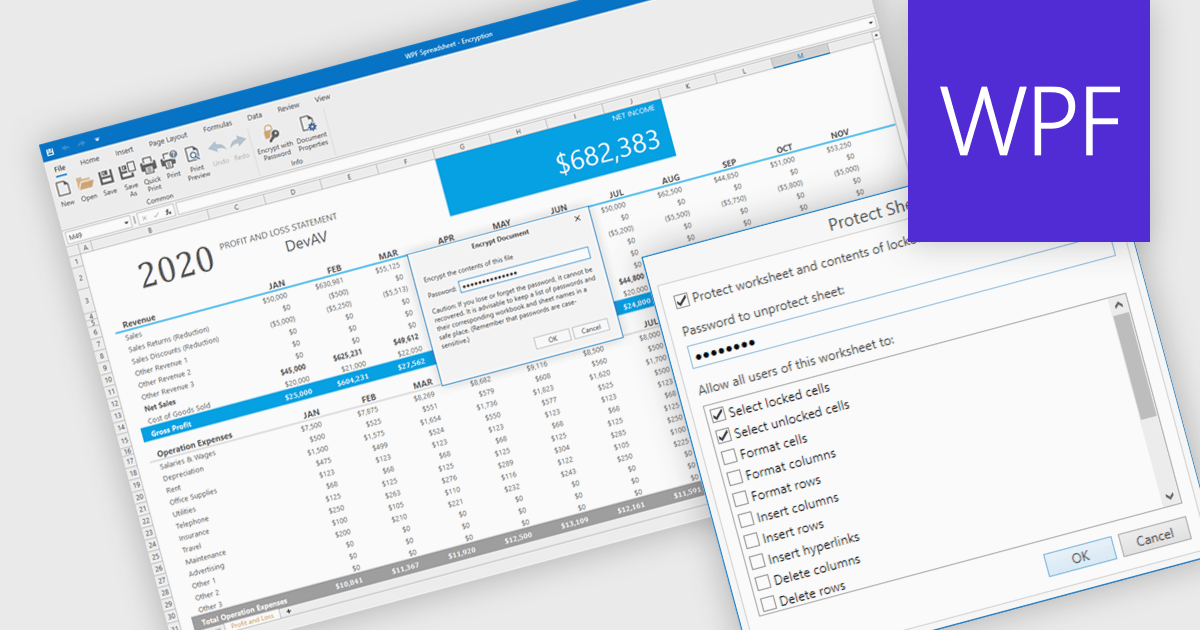
Spreadsheet security features are essential tools designed to protect sensitive data, ensure data integrity, and control user access within spreadsheet applications. These capabilities typically include such measures as password protection or cell locking, and are used to prevent the unauthorized viewing or modification of content in the spreadsheet. Implementing security measures in their spreadsheets allows organizations to maintain compliance with data security standards or data governance policies, and avoid accidental or malicious data loss or alteration. This level of control is particularly important in environments where multiple users collaborate on financial models, project plans, or other critical datasets.
Several WPF spreadsheet components offer security features, including:
For an in-depth analysis of features and price, visit our comparison of WPF spreadsheet components.
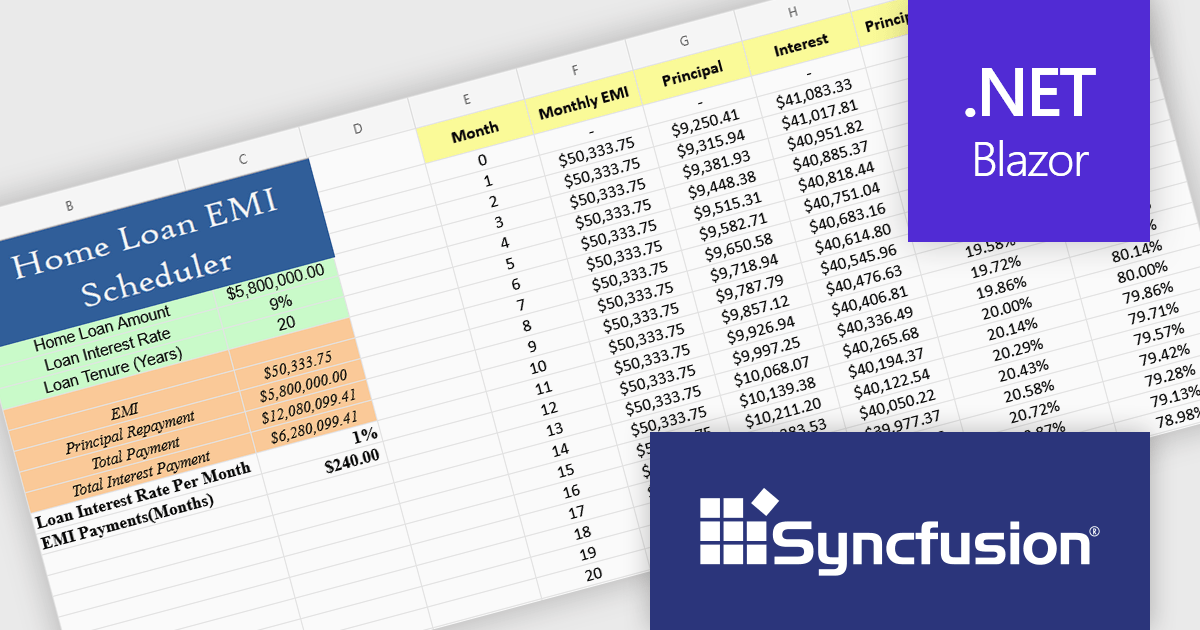
Syncfusion Essential Studio Blazor (available as part of Syncfusion Essential Studio Enterprise) is a comprehensive UI component library designed to accelerate the development of high-performance, modern web applications using the Blazor framework. It boasts over 85+ responsive, lightweight, and modular components spanning various categories such as data visualization, data editing, document processing, and interactive UI elements. This rich repertoire empowers developers to rapidly build user-friendly, feature-rich web interfaces, with seamless integration of both server-side and client-side Blazor applications.
The Syncfusion Essential Studio Blazor 2025 Volume 2 update introduces a new Spreadsheet control (in preview) that provides developers with an Excel-like environment for web applications, enabling efficient data manipulation, formula-based calculations, and file operations. This control supports core spreadsheet functionality such as cell editing, formatting, sorting, and selection, while also allowing for interactive features like dynamic resizing, autofill, image insertion, and hyperlink support. Designed with performance and scalability in mind, the Spreadsheet control helps developers manage complex data scenarios and deliver responsive, user-friendly interfaces within their Blazor applications.
To see a full list of what's new in 2025 Volume 2, see our release notes.
Syncfusion Essential Studio Blazor is available as part of Syncfusion Essential Studio Enterprise which is licensed per developer starting with a Team License of up to five developers. It is available as a 12 Month Timed Subscription License which includes support and maintenance. See our Syncfusion Essential Studio Enterprise licensing page for full details.
Learn more on our Syncfusion Essential Studio Blazor product page.
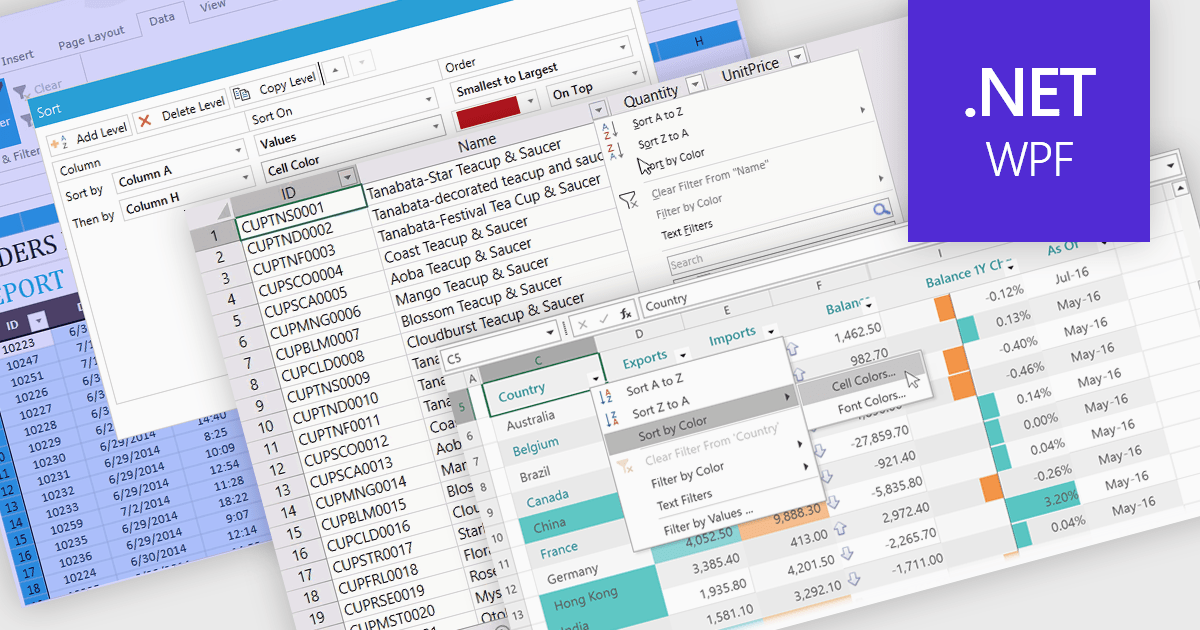
Data sorting in a spreadsheet control is a fundamental feature that enables users to rearrange data within a grid or table based on specific criteria, typically ascending or descending alphabetically or by numerical value. Sorting will usually be performed on single or multiple columns and is often integrated with other data manipulation tools like filtering, grouping, and searching. By sorting data, users can quickly locate and analyze information, identify patterns, and ensure consistency across records. Especially useful in large datasets, it improves the readability of the information and makes it more organized in preparation for decision-making, reporting, and data validation. This capability facilitates efficient data analysis, and supports better user interaction by allowing datasets to be viewed in meaningful sequences.
Several WPF spreadsheet controls offer support for data sorting including:
For an in-depth analysis of features and price, visit our WPF spreadsheet controls comparison.
SpreadJS is a high-performance JavaScript spreadsheet and data presentation component designed for enterprise web applications. It enables developers to deliver Excel-like functionality directly within their web solutions, providing advanced features such as data binding, complex calculations, pivot tables, charts, and extensive formatting options. Fully compatible with modern JavaScript frameworks like React, Angular, and Vue, SpreadJS allows seamless integration and customization, empowering development teams to create interactive, data-driven user experiences without relying on external spreadsheet applications.
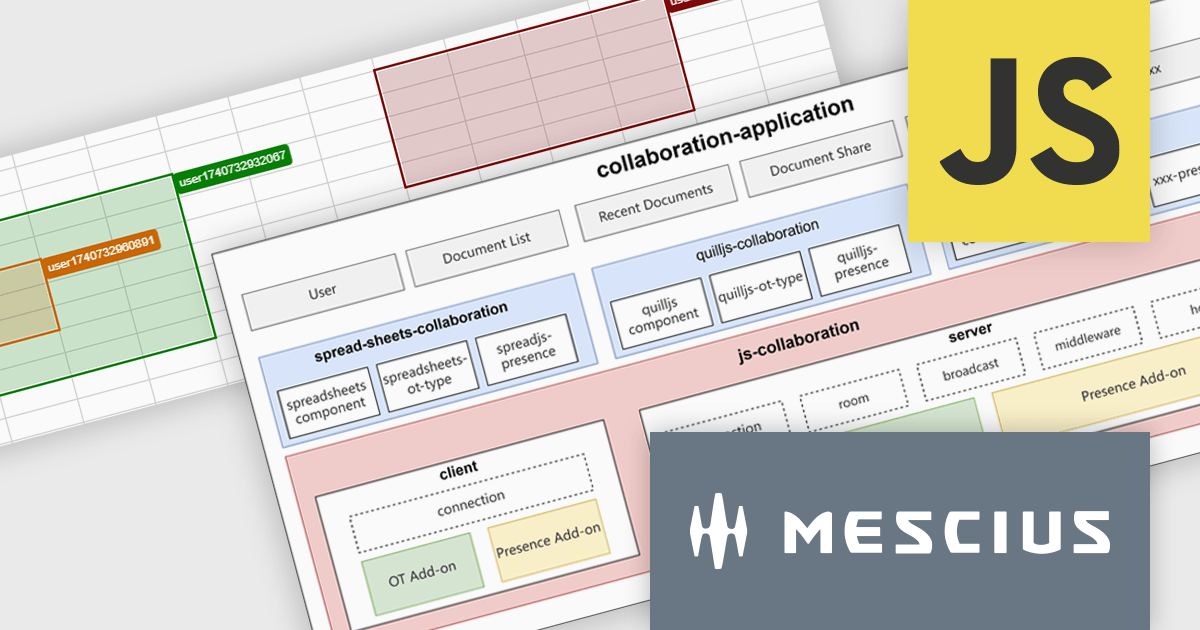
SpreadJS enables real-time collaboration within JavaScript spreadsheet applications through a modular, extensible framework currently available as a Developer Preview. This feature allows multiple users to work on the same spreadsheet simultaneously, maintaining data consistency and reducing the complexity of building collaborative functionality from scratch. It supports low-latency data synchronization, user presence indicators, and conflict-free concurrent editing, allowing multiple users to work simultaneously while maintaining consistent data states. Designed to integrate with various document types and backend systems, it simplifies the development of collaborative features without requiring developers to build the infrastructure from scratch. An online collaboration demo is available to explore these capabilities in action.
SpreadJS is licensed per developer and includes 1 Year Maintenance (major and minor version releases and unlimited support phone calls). SpreadJS requires an Annual or Perpetual Deployment License. The optional Add-ons are available at an additional cost, and require a SpreadJS license. See our SpreadJS licensing page for full details.
For more information, visit our SpreadJS product page.


Tel.: (888) 850 9911
Fax: +1 770 250 6199


