LightningChart Python
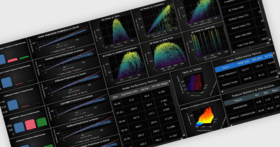
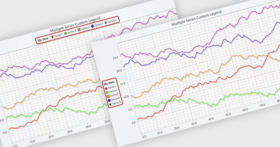
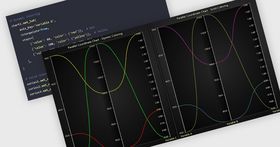
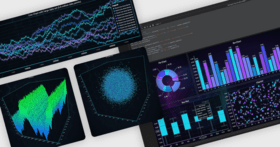
Eine leistungsstarke GPU-beschleunigte 2D- und 3D-Datenvisualisierungsbibliothek für Python-Apps zur Datenanalyse und Softwareentwicklung.
Veröffentlicht von LightningChart
Wird von ComponentSource seit 2021 vertrieben
Preise ab: US$ 882.00 Version: v2.2 Letzte Aktualisierung: Apr 7, 2026