Über LightningChart Python

Eine leistungsstarke GPU-beschleunigte 2D- und 3D-Datenvisualisierungsbibliothek für Python-Apps zur Datenanalyse und Softwareentwicklung.

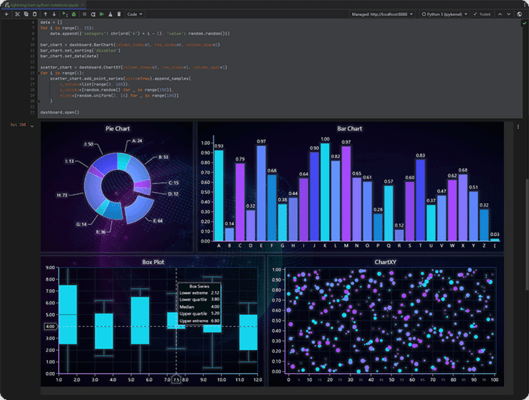
LightningChart Python is a high performing data visualization library for the Python programming language. It allows you to present real-time or static data as fast and interactive 2D or 3D charts. Designed for data scientists and software developers, this GPU-accelerated charting library can handle large static datasets or dynamic real-time streaming data by utilizing graphics processors and WebGL rendering for the smooth visualization of up to millions of data points.

LightningChart Python Features

  • When dealing with massive static datasets or dynamic real-time streaming data, LightningChart Python can be used to turn them into fully interactive and responsive charts with smooth performance.
  • LightningChart Python achieve this by harnessing the raw processing power of graphics processors and leveraging WebGL rendering, enabling the smooth visualization of up to millions of data points.
  • The integration of LightningChart Python assists data scientists, researchers, and educators by simplifying exploratory data analysis, whether they are writing standalone scripts or utilizing Notebook environments.
  • The library can be used along side popular data science modules like NumPy and Pandas, and provides the ability to design visually compelling and dynamic dashboards.
  • It includes an extensive collection of different 2D and 3D chart types, such as line graphs, scatter plots, heatmaps, area graphs, box plots, figures and shapes, mesh models, pie charts, gauge charts, map charts, funnel and pyramid charts, and more, all of which come with appearance customization options.
  • When developing traditional software, for example a desktop application, these charts can be used within widely-used GUI frameworks, such as PySide and PyQt, to embed dynamic and interactive visuals into Python projects.
  • For developing solutions for business analytics, monitoring, scientific simulations, or other fields, this library makes the process of adding high-performance visuals easy.

Data Scientist license

  • A personal, subscription-based license designed for data enthusiasts working on personal Python projects. Tailored for Python environments, including Python notebooks, this license gives you access to an extensive suite of data visualization tools.

Software Developer license

  • Designed for professional software developers, this license offers a perpetual, per-seat solution for integrating LightningChart Python into commercial, distributable software applications.