


Fournisseur officiel
Comme nous somme les distributeurs officiels et autorisés, nous vous fournissons des licences légitimes directement à partir de 200+ éditeurs de logiciels.
Voyez toutes nos marques.

ComponentSource and Optimajet have built a strong partnership focused on helping developers create, manage, and render complex web forms. OptimaJet provides flexible, developer-friendly components designed to simplify business process management, enabling teams to build scalable, efficient applications while reducing development time and cost.
At the core of their offering is Optimajet FormEngine, which helps developers to rapidly design dynamic, customizable forms with minimal effort. It supports complex logic and data handling, and provides the flexibility needed to adapt forms to specific business requirements across a wide range of industries.
This collaboration enables ComponentSource to further differentiate its product portfolio by offering advanced form-building solutions that meet modern development demands. By distributing OptimaJet’s products globally, ComponentSource ensures developers worldwide can easily access, evaluate, and implement these tools, strengthening its position as a trusted source for high-quality development components.
Learn more about Optimajet.
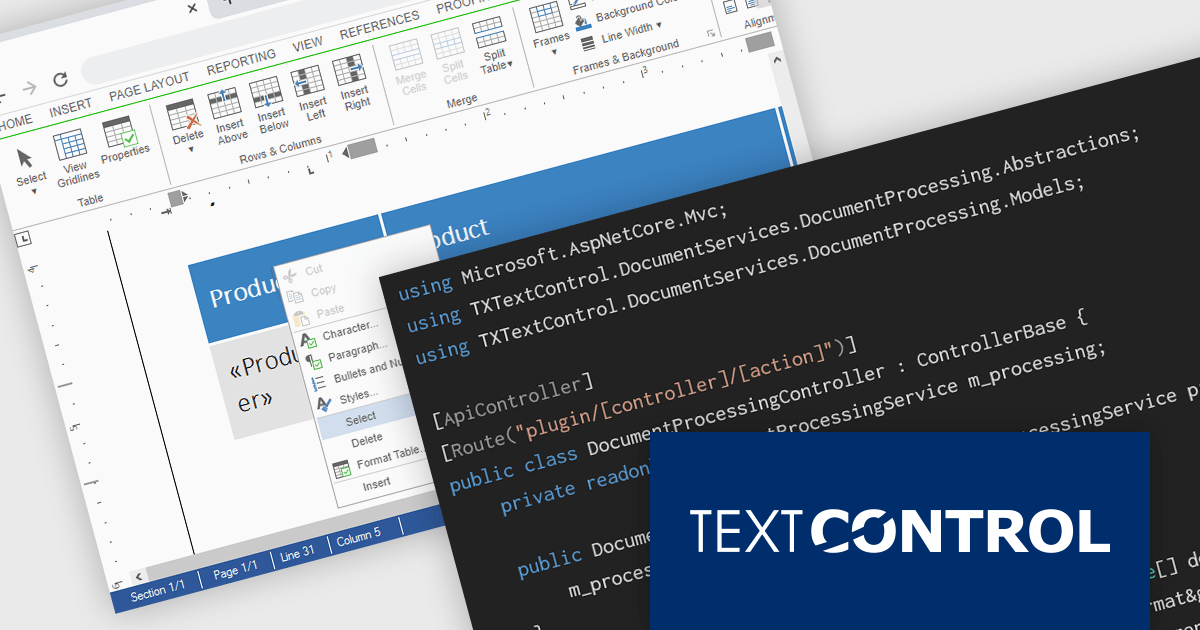
TX Text Control DS Server is a server-side document processing solution designed to integrate document generation, editing, and conversion capabilities into modern applications. Built for web, cloud, and service-based environments, it enables developers to programmatically create and manipulate rich-text documents such as DOCX, PDF, and HTML within their own systems. With APIs designed for integration into .NET applications and other backend services, it supports scenarios such as automated document generation, template-based reporting, and document workflows. By providing high-fidelity rendering and robust document processing on the server, it helps development teams incorporate powerful document functionality into enterprise applications without relying on client-side tools.
The DS Server 5.0 update introduces new Dependency Injection services for plugins, making it easier for developers to extend and integrate DS Server within enterprise applications. Using ASP.NET Core Dependency Injection, plugins can now access internal DS Server functionality through two new services. The IDocumentProcessingService provides programmatic access to document processing capabilities such as document conversion, mail merge processing, document manipulation, PDF form field extraction, and barcode generation. In addition, the IDocumentEditorSessionService enables plugins to interact with active Document Editor sessions, allowing developers to access and modify live documents, work with form fields, adjust formatting, or implement custom logic tied to editor activity. Together, these services provide a flexible way to build powerful extensions and integrate DS Server into complex systems and backend services.
To see a full list of what's new in version 5.0, see our release notes.
Text Control DS Server is licensed per server and is available as an Annual License that includes software updates. See our Text Control DS Server licensing page for full details.
For more information, visit our Text Control DS Server product page.

React components in UI suites provide prebuilt, reusable building blocks for creating modern, responsive web applications using the React framework. These components are designed to integrate effortlessly into React's declarative model, enabling developers to construct complex user interfaces while maintaining consistency, performance, and maintainability. By offering a comprehensive set of controls and visual elements, UI suites help accelerate development and reduce the effort required to implement advanced functionality from scratch.
Common controls include:
For an in-depth analysis of features and price, visit our React UI suites comparison.
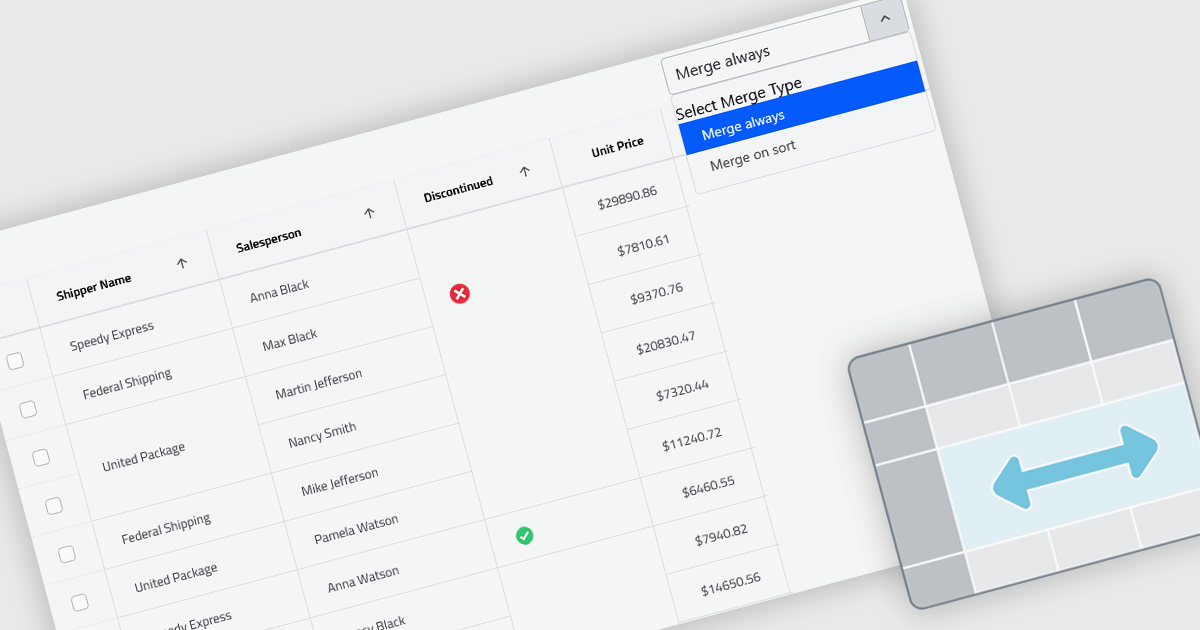
Cell merging in grids combines adjacent cells with matching or conditionally defined values into a single cell, typically within a column. This reduces repetitive data and creates cleaner, more readable tables that are easier to scan and understand. By visually grouping related rows, it helps highlight patterns and relationships in large datasets. The feature can be applied automatically or customized, making it useful for scenarios such as financial reports, schedules, and inventory lists where repeated values can be consolidated for better clarity.
Several React grid controls offer cell merge support including:
For an in-depth analysis of features and price, visit our React grid controls comparison.
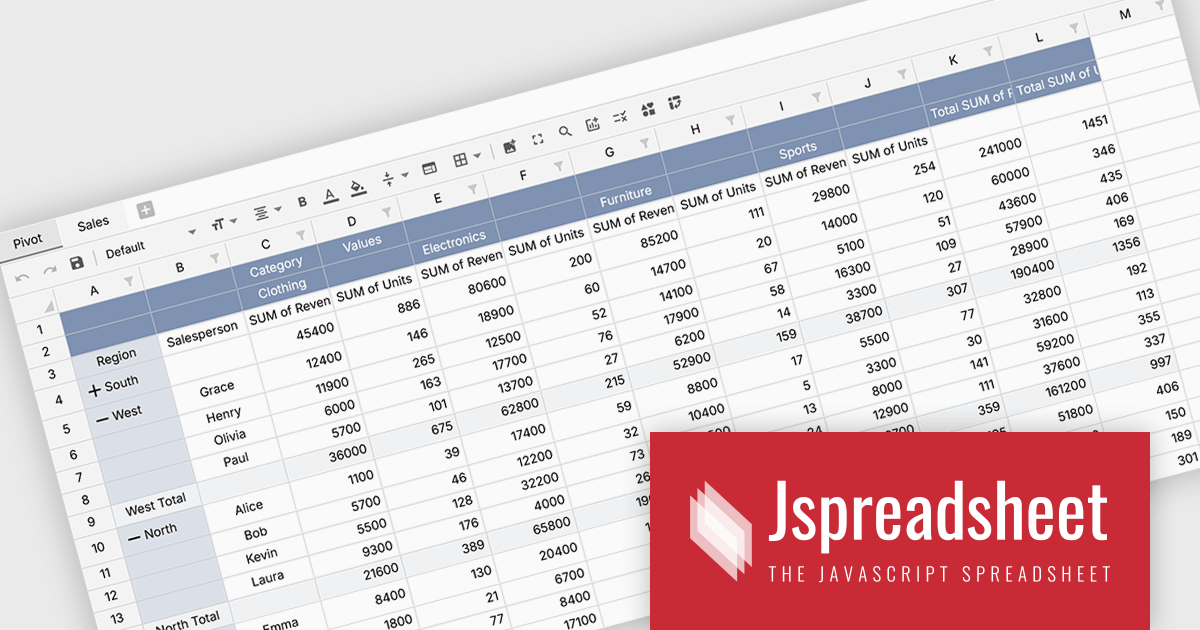
Jspreadsheet Pro is a flexible JavaScript-based spreadsheet solution that enables developers to create customizable, feature-rich data grids for web applications. It offers advanced formulas, data validation, and API integrations. Ideal for tasks like financial modeling, inventory management, and project tracking, it helps businesses efficiently manage and analyze data.
Jspreadsheet Pro introduces pivot table functionality that allows developers to summarize and analyze large datasets directly within browser based spreadsheet applications. It enables users to group data across multiple rows and columns, apply aggregation methods such as sum or average, and refine results through filtering and sorting. With built in spreadsheet formulas and cross worksheet references, developers can provide interactive data analysis capabilities without requiring external tools or additional backend processing.
Jspreadsheet Pro is licensed as an Annual or a Perpetual License with support and maintenance. We can supply any Jspreadsheet Pro license including new licenses, maintenance renewals, and upgrade licenses. See our Jspreadsheet Pro for full details.
For more information, visit our Jspreadsheet Pro product page.


Tél : (888) 850 9911
Fax : +1 770 250 6199


