


공식 공급 업체
200 이상의 소프트웨어 개발처와 판매 계약을 맺은 공인 디스트리뷰터로서 합법적인 라이선스를 제공합니다.
모든 브랜드 보기.
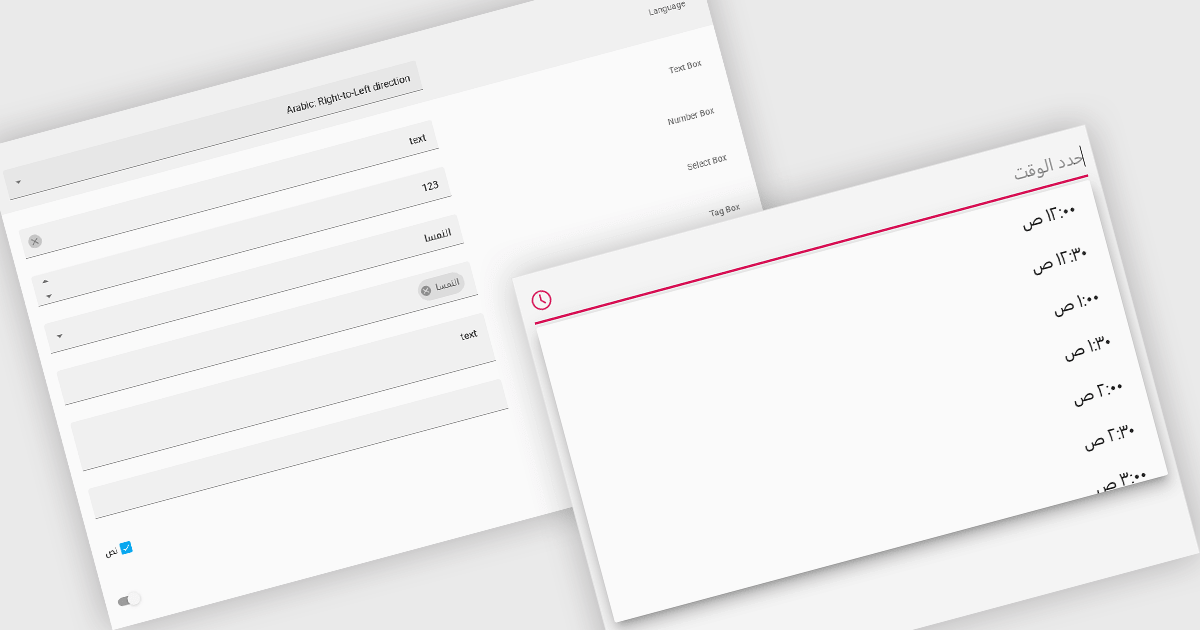
Right-to-left (RTL) support in a data editor component enables the user interface and content layout to be displayed in a direction consistent with languages that are read from right to left, such as Arabic or Hebrew. This includes aligning text, input fields, table structures, and control elements to the right side of the screen, while preserving correct data formatting and interaction behavior. For software developers, RTL support ensures that applications can be properly localized for RTL language audiences without compromising usability or data readability.
Several React data editors offer right to left (RTL) support including:
For an in-depth analysis of features and price, visit our React data editors comparison.
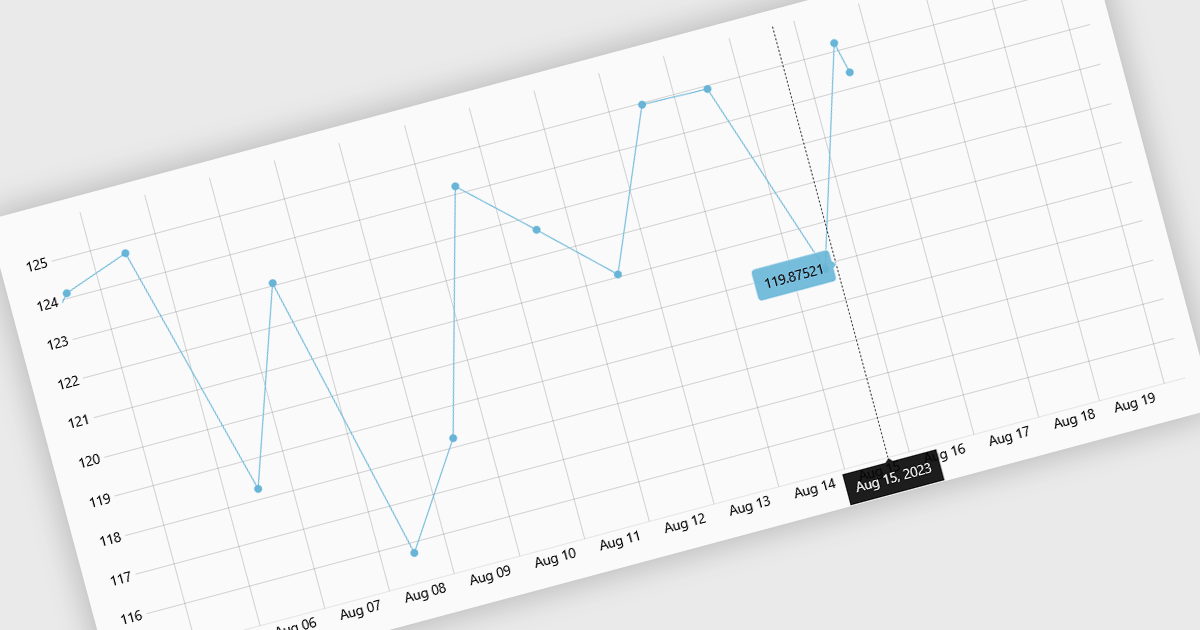
Live data support for charts enables visualizations to update automatically as new information arrives, turning static dashboards into continuously refreshed, real-time views. This reduces reliance on manual refreshes or scheduled reports and helps prevent decisions based on stale data. Teams gain immediate insight into changing conditions, spotting anomalies, performance issues, or opportunities as they emerge. Typical use cases include monitoring website traffic, application performance, financial markets, IoT sensors, and business KPIs such as orders, revenue, or support queues. By making current metrics instantly visible, live charts improve responsiveness, operational control, and confidence in data-driven decisions and outcomes across the organization.
Several React chart controls support live data including:
For an in-depth analysis of features and price, visit our React chart controls comparison.
Infragistics Professional is a comprehensive suite of UI components designed to accelerate the development of high-performance, visually rich applications across several platforms. It provides developers with a vast collection of tools for building data-driven interfaces, including advanced grids, charts, and reporting features for web, desktop, and mobile environments.
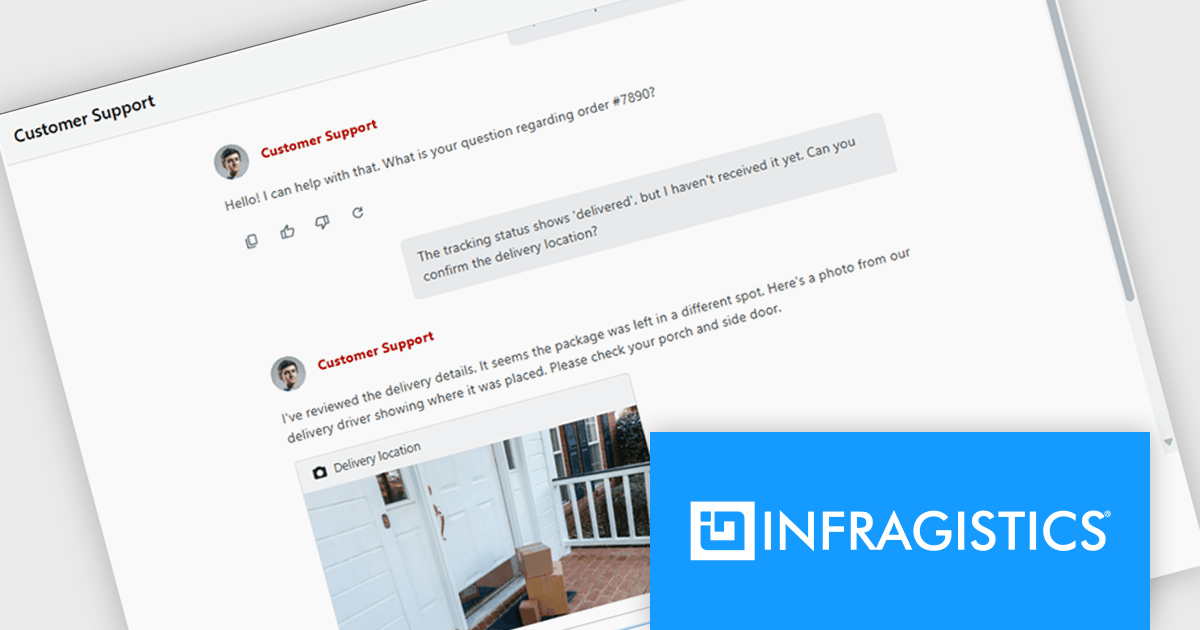
The Infragistics Professional 25.2 release introduces an AI Chat control for React and Web Components. It provides a solid foundation for building responsive, real-time conversational interfaces in your applications. Whether you're creating a customer support tool, a collaborative chat workspace, or an AI assistant, this component includes essential features such as text messaging, file attachments, quick reply suggestions, and typing indicators. Unlike static message lists, it manages input, interaction, and rendering dynamically, ensuring a smooth user experience. The component also offers a robust rendering API that allows full customization of layout and visual elements, giving you control over how your chat interface looks and behaves.
To see a full list of what's new in version 25.2, see our release notes.
Infragistics Professional is licensed per developer and is available as a Perpetual License with a 1, 2 or 3 year support and maintenance subscription. See our Infragistics Professional licensing page for full details.
For more information, visit our Infragistics Professional product page.
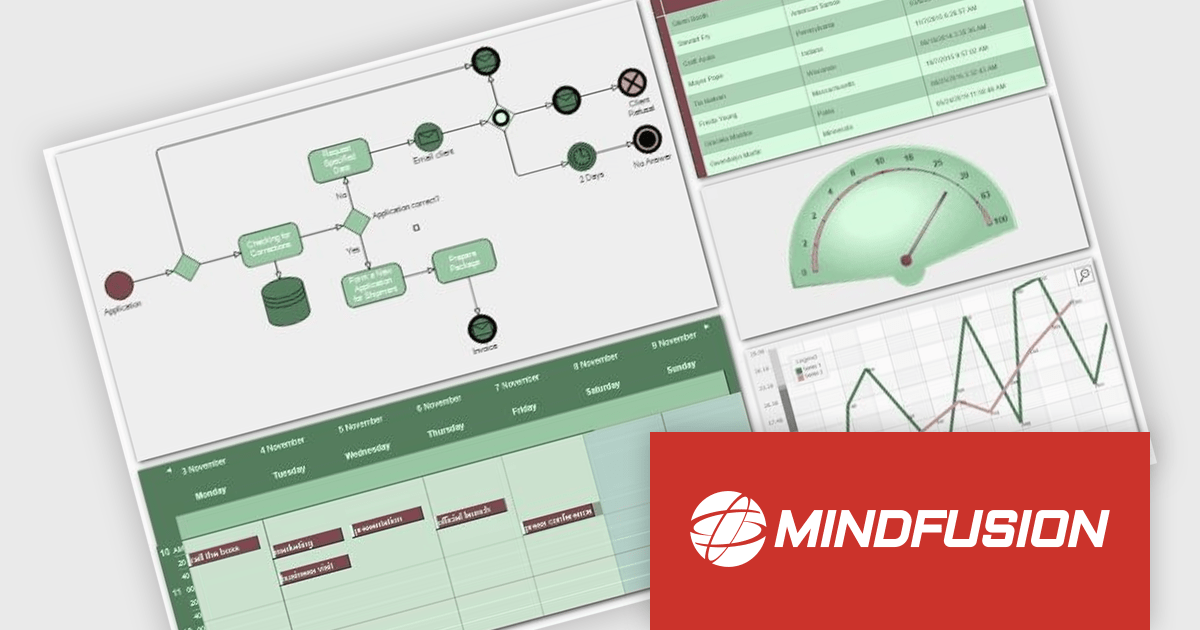
MindFusion JavaScript Pack is a collection of interactive JavaScript libraries that help developers create dynamic and user-friendly web applications. It includes components such as diagrams, charts, grids, calendars, menus, and tree views, all offering easy customization and smooth interactivity. Users can drag and drop nodes, rotate elements, scroll timelines, create appointments, and edit text directly within the interface. With its flexible design and wide range of features, MindFusion JavaScript Pack is ideal for building dashboards, scheduling tools, and data visualizations that enhance user engagement and streamline development.
The MindFusion JavaScript Pack 2025 R2 update introduces Paged Containers to help developers organize complex diagrams more efficiently. This new feature allows related diagram elements to be grouped within separate pages inside a single container, making it easier to manage and navigate large or multi-section diagrams. By structuring content in pages, developers can maintain a clear visual hierarchy, reduce clutter, and improve performance when working with extensive data models. Paged Containers provide a practical way to create scalable, well-organized diagram layouts that enhance both usability and maintainability in advanced web applications.
To see a full list of what's new in version 2025 R2, see our release notes.
MindFusion JavaScript Pack is licensed per developer and is available as a perpetual license with 1 year subscription and support. See our MindFusion JavaScript Pack licensing page for full details.
For more information, visit our MindFusion JavaScript Pack product page.
Infragistics Ultimate is a comprehensive development toolkit designed to streamline the creation of high-performance, visually rich applications across multiple platforms. It includes a wide range of user interface (UI) components and development tools for web, desktop, and mobile applications, supporting frameworks such as Angular, React, Blazor, .NET, and more.
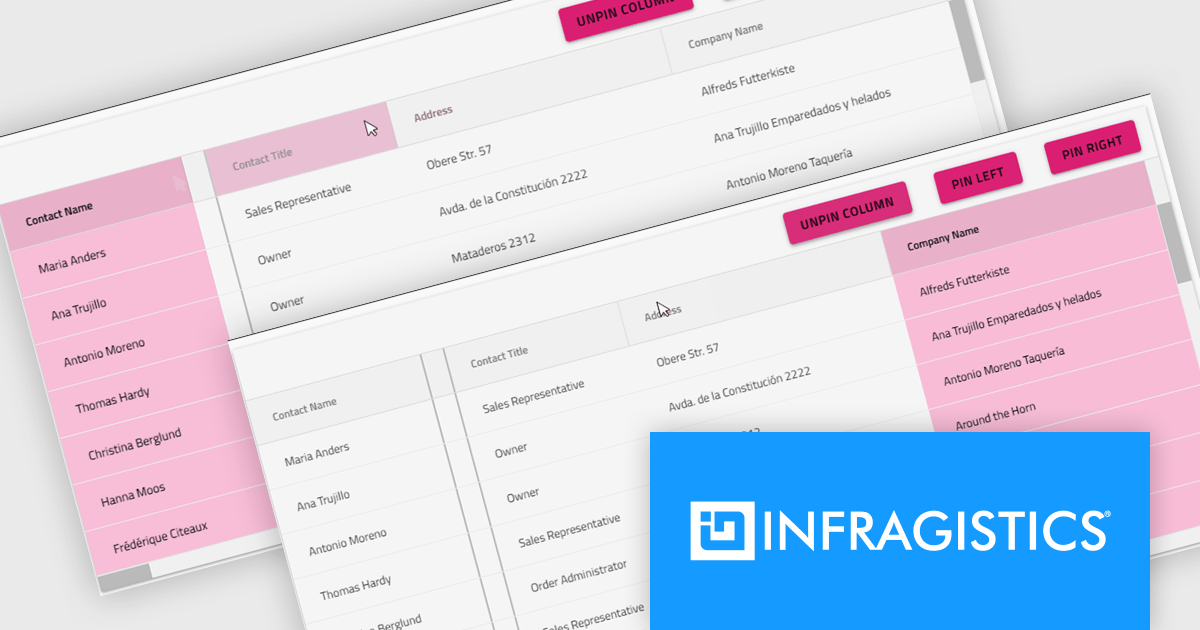
The Infragistics Ultimate 25.2 release includes a feature that lets developers specify individual pinning locations for each grid column, making it possible to fix important data on both the left and right edges of a grid. This added flexibility helps create cleaner, more efficient layouts that keep key information visible at all times. Whether you’re working in Angular, React, Web Components, or Blazor, this capability improves data presentation, simplifies large dataset navigation, and enhances the overall usability of modern web applications.
To see a full list of what's new in version 25.2, see our release notes.
Infragistics Ultimate is licensed per developer and is available as a Perpetual License with a 1, 2 or 3 year support and maintenance subscription. See our Infragistics Ultimate licensing page for full details.
For more information, visit our Infragistics Ultimate product page.
전화 : 00798 14 800 6332
팩스 : +1 770 250 6199


