


공식 공급 업체
200 이상의 소프트웨어 개발처와 판매 계약을 맺은 공인 디스트리뷰터로서 합법적인 라이선스를 제공합니다.
모든 브랜드 보기.
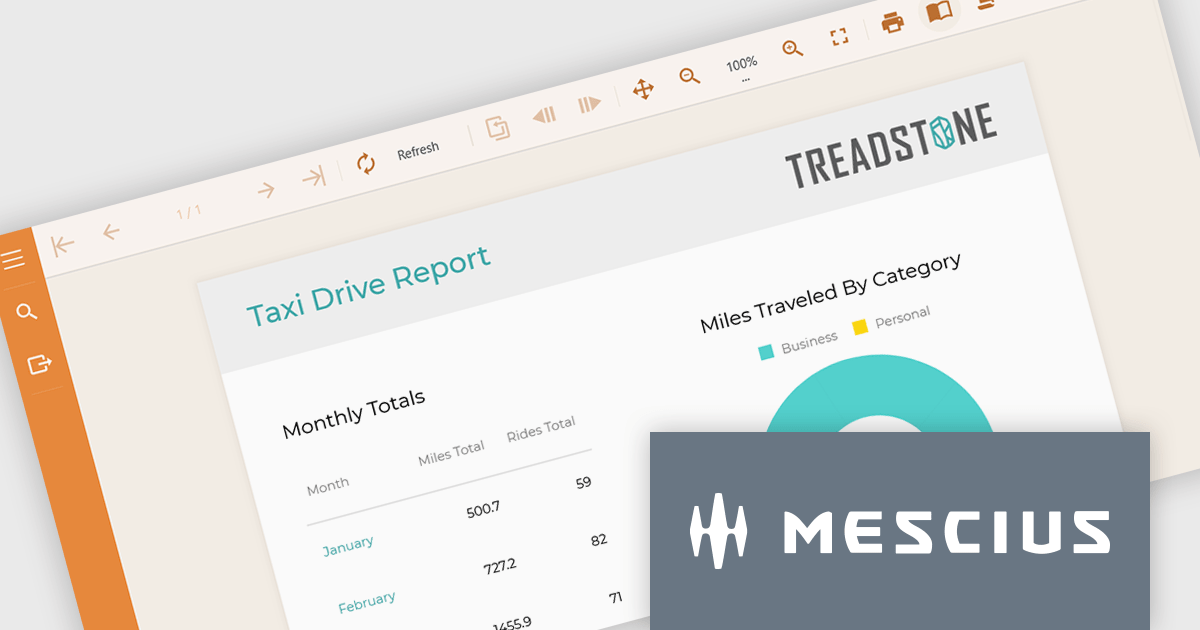
ActiveReportsJS is a powerful, lightweight reporting tool designed to seamlessly integrate advanced reporting capabilities into any JavaScript application. ActiveReportsJS enables developers to create, view, export, and print richly formatted reports entirely on the client side - with zero server dependencies.
On July 24, 2025 at 11:00 AM EDT, MESCIUS (formerly GrapeCity) will be presenting a CodeClinic Live Webinar to demonstrate how you can include the ActiveReportsJS Report Viewer and Report Designer in your application. From implementing the controls to a step-by-step process on how to build reports, by the end, you'll have all of the tools needed to incorporate an advanced reporting solution in your web applications.
Register for the LIVE webinar today, and mark your calendar for July 24.
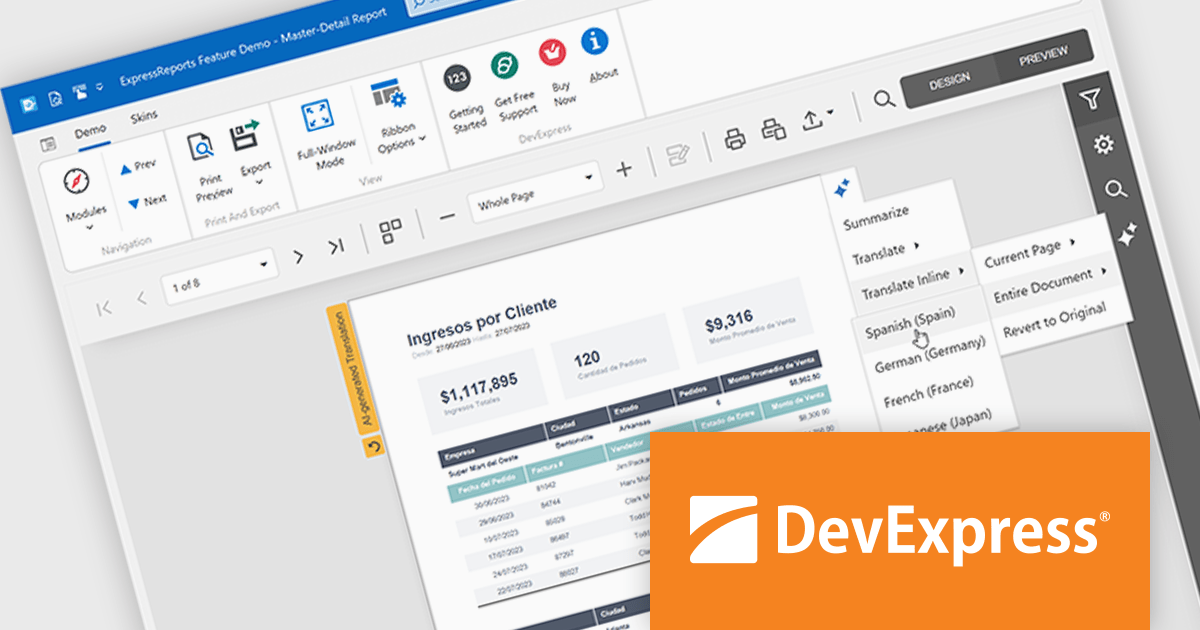
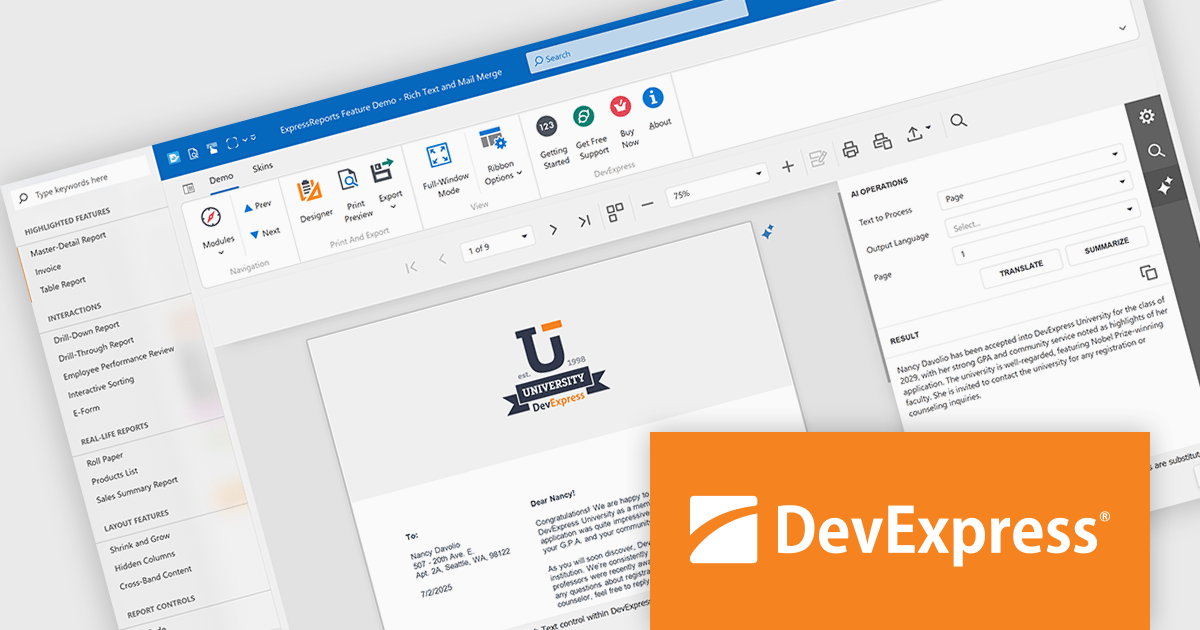
DevExpress (Developer Express) is an award-winning software development company based in the United States. It produces coding assistance tools and components for Delphi, C++ Builder and Microsoft Visual Studio developers. The major part of its product line is VCL, .NET WinForms and ASP.NET components that replicate the UI of Microsoft Windows and Microsoft Office applications.
With the recent release of version 25.1, the entire DevExpress product line has undergone significant changes:
This powerful new functionality comes at a higher price. DevExpress has implemented price raises across all product lines for both new licenses and renewals. To view all of the current, updated prices, see the comprehensive product list on the DevExpress Brand Page.
**Note: If you have a current, valid quote from ComponentSource at the previous pricing, the price will be honored up to that quote's expiration date.
The DevExpress VCL Subscription + (DevExpress VCL Subscription Plus) includes:
DevExpress Reporting is available to buy in the following products:
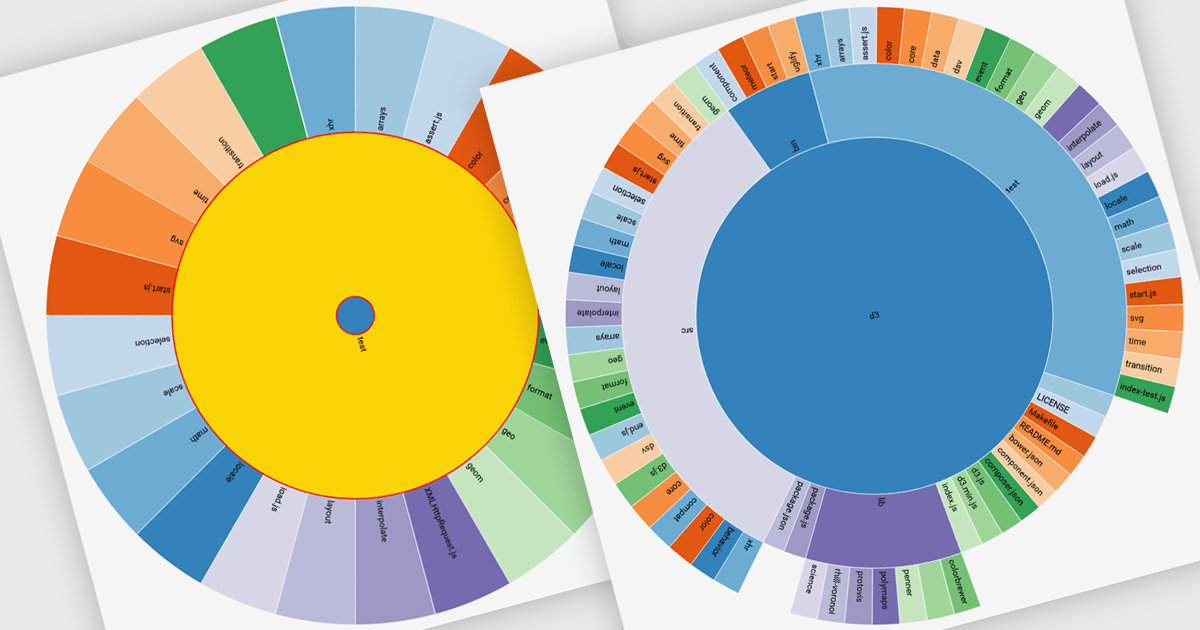
Radial charts are circular data visualizations used to represent hierarchical, proportional, or cyclical data. A key type is the sunburst chart, which displays multi-level hierarchies using concentric rings, where each ring represents a level and each segment shows a category or subcategory. This format helps users quickly grasp both structure and proportion. Sunburst charts are ideal for exploring complex data in a compact space and are commonly used for visualizing organizational charts, file systems, website structures, and product categories. Their interactive format allows users to drill into data for deeper insight without losing context.
Several JavaScript charting components provide you with radial charts, including:
For an in-depth analysis of features and price, visit our JavaScript chart components comparison.
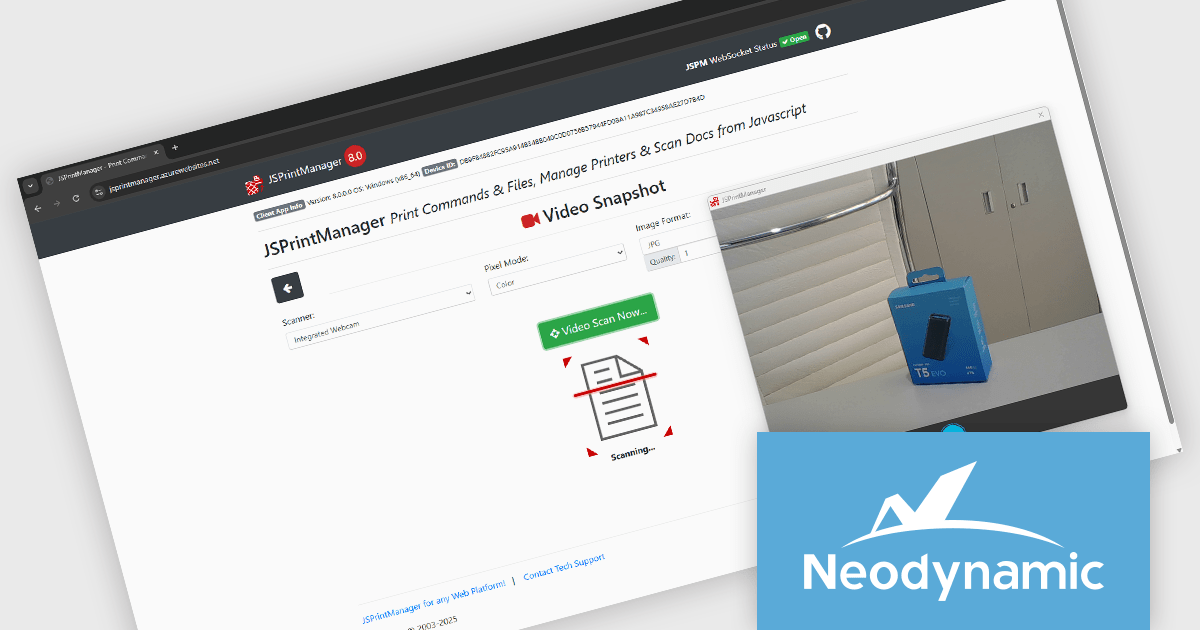
Neodynamic offers two JSPrintManager solutions for client-side printing and scanning in web applications. JSPrintManager for Any Web Platform allows you to integrate printing functionality into any website built with technologies like ASP.NET, PHP, or Blazor using pure JavaScript. Neodynamic also offers JSPrintManager for Blazor which enables you to seamlessly add printing capabilities to your Blazor server or WebAssembly projects with C# code. Both solutions empower you to print various data formats directly from the browser without requiring user interaction with print dialogs.
The Neodynamic JSPrintManager 8.0 releases add the ability for the Windows Client to take a video snapshot through any video device available on the client PC. This means, for example, that a camera can be used as a scanner to take a snapshot/picture. This is particularly useful in contexts where quick documentation is needed, such as capturing IDs, receipts, or physical documents, without needing a separate scanning application. It reduces reliance on traditional scanners and broadens the type of input devices that can integrate with browser-based printing operations.
To see a full list of what's new in 8.0, see our release notes for JSPrintManager for Any Web Platform and JSPrintManager for Blazor.
Neodynamic JSPrintManager is licensed per Web App and Web server and is available as a Perpetual license which includes 1 year of free updates and priority support. See our Neodynamic JSPrintManager for Any Web Platform and Neodynamic JSPrintManager for Blazor licensing pages for full details.
Learn more on our Neodynamic JSPrintManager for Any Web Platform and Neodynamic JSPrintManager for Blazor product pages.
DevExpress VCL Subscription + (DevExpress VCL Subscription Plus) is an enhanced offering for Delphi and C++Builder developers, combining its traditional VCL components with a comprehensive suite of web UI libraries. The subscription includes access to DevExpress's JavaScript, ASP.NET Core, and Blazor UI components, enabling developers to build both native Windows applications and modern web applications under a single license.
The VCL Subscription provides a robust set of native Windows UI components designed for high-performance desktop development. It includes popular controls such as the Grid, TreeList, Rich Edit, Scheduler, and Pivot Grid, which are optimized for responsiveness and a consistent Windows look and feel. These components support advanced features like data grouping, filtering, charting, and document editing, giving developers the tools to create sophisticated, business-grade applications. Designed specifically for VCL (Visual Component Library), this suite ensures deep integration with the Windows API and RAD Studio environment, offering speed, stability, and ease of customization.
The "+" in VCL Subscription + expands this toolkit with access to DevExpress JavaScript, ASP.NET Core, and Blazor UI libraries. These include support for modern web frameworks like Angular, React, and Vue through the JavaScript UI suite, which features controls such as DataGrid, Scheduler, Charts, and Dashboard. The ASP.NET Core and Blazor components bring server-side and client-side capabilities, allowing developers to use C# and Razor for web development while leveraging rich UI elements. For those accustomed to building with VCL, these additions offer a path to web development without sacrificing familiar design patterns or DevExpress quality. It opens the door to hybrid applications and future-proof solutions that span both desktop and web environments.
DevExpress VCL Subscription + is licensed per developer and is available as a Perpetual License with a 12 month support and maintenance subscription. See our DevExpress VCL Subscription + licensing page for full details.
For more information, visit our DevExpress VCL Subscription + product page.
전화 : 00798 14 800 6332
팩스 : +1 770 250 6199


