













공식 공급 업체
200 이상의 소프트웨어 개발처와 판매 계약을 맺은 공인 디스트리뷰터로서 합법적인 라이선스를 제공합니다.
모든 브랜드 보기.
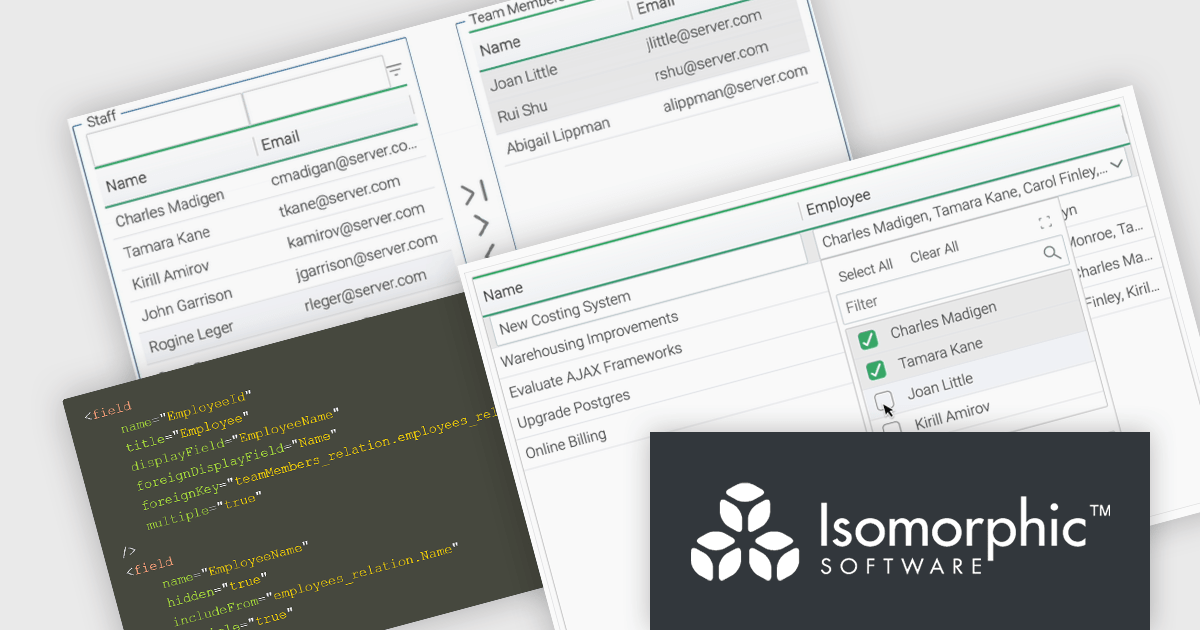
SmartClient is a comprehensive JavaScript component suite compatible with React, Vue, Angular, and more, that allows you to create large-scale, high-productivity web applications. It provides a comprehensive set of tools for developers, including advanced UI components, robust data management capabilities, and integration with modern backend technologies. Key features include dynamic data fetching, customizable grids, and a responsive interface for a wide range of devices. SmartClient enables developers to create applications with optimized performance, scalability, and a superior user experience. Ideal for enterprise-grade use cases, such as financial analytics, inventory management, and real-time reporting, SmartClient empowers organizations to deliver feature-rich applications that handle complex data requirements with ease.
Relations connect objects to each other and are used in databases and systems that are object-oriented. SmartClient lets you declare these relations in your data source using Relation Fields, providing a full access to related data without the need to write additional code. With two new user interface (UI) components for editing related records and the Relation Fields feature, it is now easier to manage many-to-many relationships. "MultiPickerItem" is a compact control used for inline form editing where the selected values appear inline and a pop-up displays checkboxes to enable users to select from a related data source. The Shuttle Interface can be embedded in any layout, including forms and modals, and provides a visual dual-panel interface for handling multi-item associations. These features simplify the management of relational data, offering users a declarative, scalable, and user-friendly approach.
SmartClient is licensed per developer and is available as both perpetual and subscription licenses. Product updates and technical support is also available. See our SmartClient licensing page for full details.
For more information, visit our SmartClient product page.
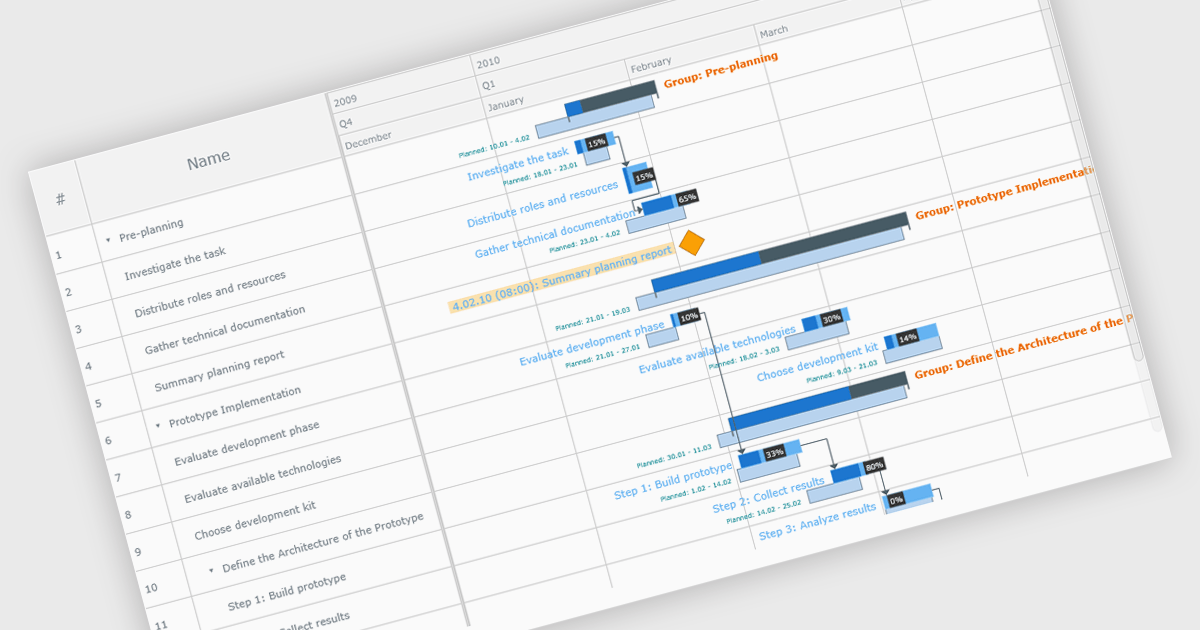
A Gantt chart is a visual project management tool that displays tasks or activities along a timeline, allowing teams to see the start and end dates, duration, and dependencies of each task within a project. Typically represented as horizontal bars across a calendar-based axis, Gantt charts provide a clear overview of project progress and help identify potential bottlenecks or scheduling conflicts. Gantt charts improve planning, scheduling, team coordination, and stakeholder transparency by clearly organizing tasks and timelines. They are especially valuable in complex projects, offering both macro and micro views to support informed decision-making and efficient execution.
Several JavaScript chart controls provide Gantt charts including:
For an in-depth analysis of features and price, visit our JavaScript chart controls comparison.
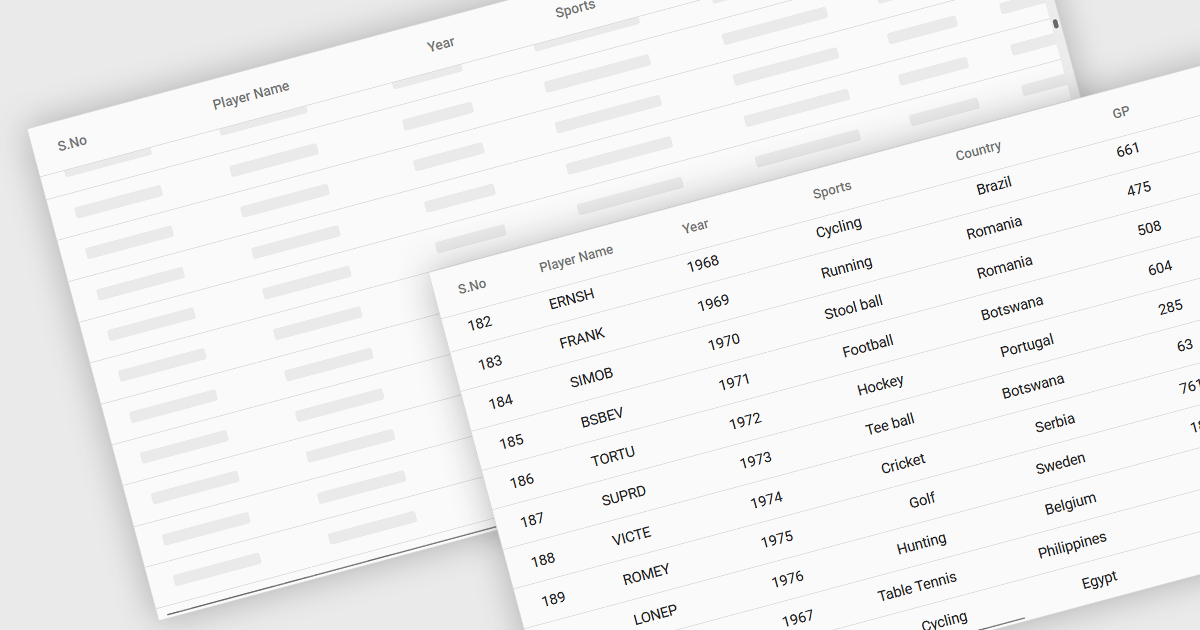
The ability to load items in a data grid as you scroll is a technique where content is rendered or fetched dynamically based on the user’s scroll position. Its purpose is to improve performance, and ultimately the user experience, when dealing with large datasets. This includes virtual scrolling, where the grid only renders rows that are currently visible in the viewport and reuses those same DOM elements as the user scrolls, and infinite scrolling (also known as endless scrolling), where additional data is loaded from a remote source in response to reaching the end of the currently displayed dataset. By minimizing the amount of data rendered or retrieved at any one time, this approach significantly reduces initial load times, improves responsiveness, and allows applications to scale efficiently.
Several JavaScript grid components allow you to load items as the user scrolls, including:
For an in-depth analysis of features and price, visit our comparison of JavaScript grid components.
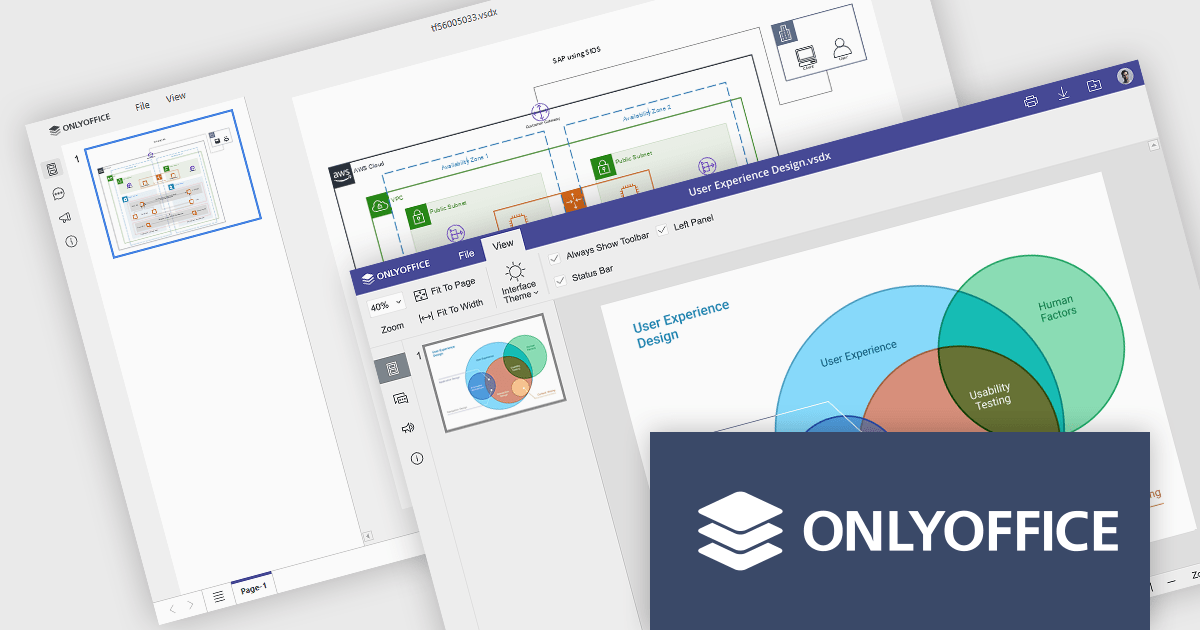
ONLYOFFICE Docs is a comprehensive online editor, allowing users to create text documents, spreadsheets, presentations, and forms. It enables your users to edit, share, and collaborate on documents online in their preferred browser, within your own application. It is fully compatible with OOXML (Office Open XML) formats and supports popular Microsoft Office and other document formats such as CSV, DOC, DOCX, EPUB, HTML, ODP, ODS, ODT, PDF, PPT, PPTX, RTF, TXT, XLS, and XLSX.
The ONLYOFFICE Docs v9.0 update adds a multi-platform integrated Diagram Viewer tool that allows users to view and navigate Microsoft Visio (.vsdx) files natively across devices, on web, desktop, and mobile web platforms, without requiring third-party software. With intuitive controls, zooming and panning, it provides effortless navigation whilst visualizing ideas and workflows as diagrams. Whether an IT manager is mapping infrastructure or a student is presenting a flowchart, the viewer ensures ideas and systems are clearly communicated.
To see a full list of what's new in v9.0.0, see our release notes.
ONLYOFFICE Docs is licensed by the number of simultaneous document connections and is available as an annual license with 1 year support and upgrades. See our ONLYOFFICE Docs licensing page for full details.
For more information, see our ONLYOFFICE Docs product page.
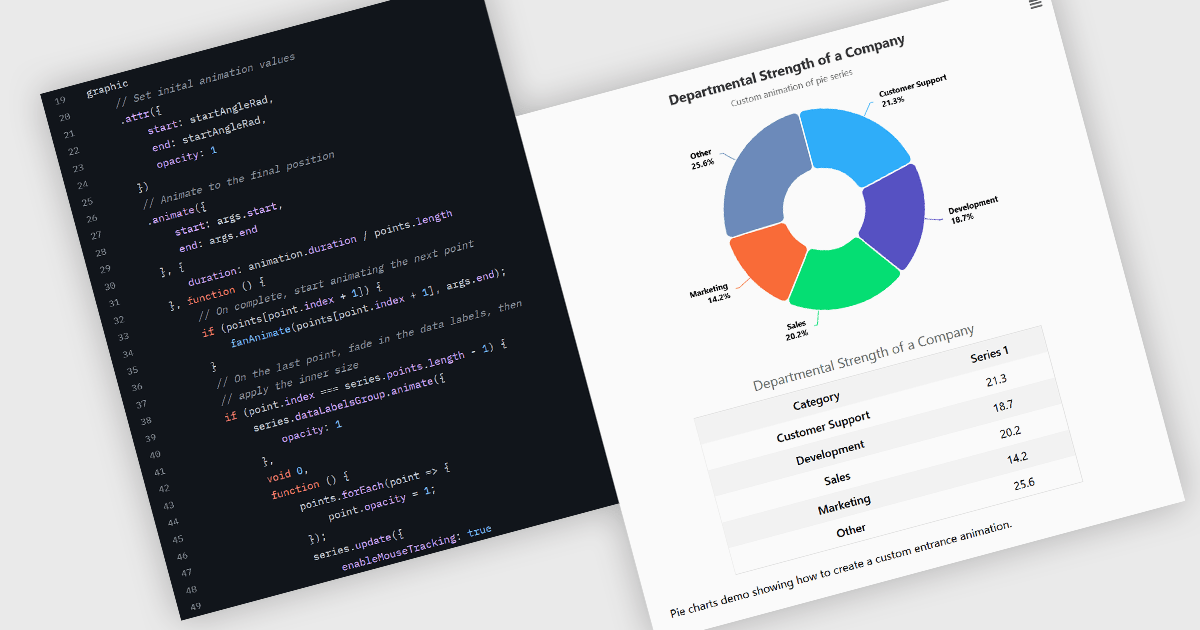
Animation in charts is a feature used in data visualization to visually transition between different data states or configurations. This technique helps communicate changes in data over time or between user interactions in a smooth, progressive manner. Rather than instantly switching from one state to another, animation introduces motion that can guide users’ attention, reinforce patterns, and reduce confusion. It is particularly useful in interactive dashboards and real-time analytics, where users benefit from a clearer understanding of what has changed and how.
Several Vue.js charting components support the use of animations, including:
For an in-depth analysis of features and price, visit our comparison of Vue.js chart components.
전화 : 00798 14 800 6332
팩스 : +1 770 250 6199


