













공식 공급 업체
200 이상의 소프트웨어 개발처와 판매 계약을 맺은 공인 디스트리뷰터로서 합법적인 라이선스를 제공합니다.
모든 브랜드 보기.
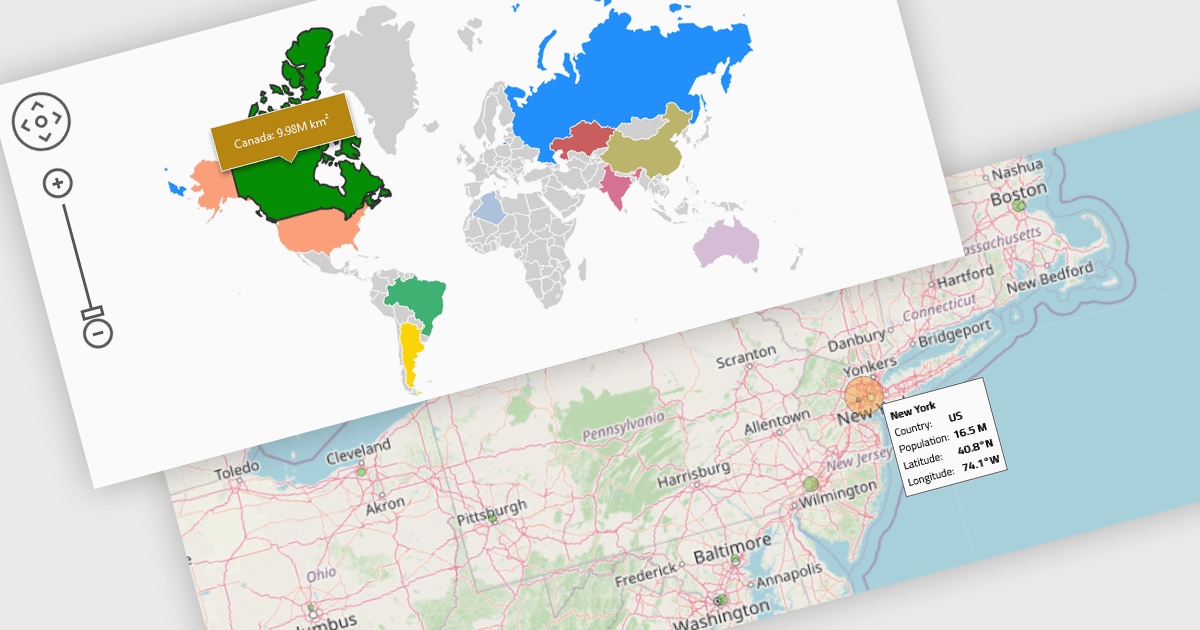
Map components enable the integration of dynamic maps within applications, often enabling features such as zooming, markers, and layers. These maps enhance user experience by displaying geospatial data in real time and across devices. Benefits include responsiveness and high performance, with common use cases such as tracking deliveries, visualizing demographic data, or displaying store locations interactively.
Several React UI suites provide map controls including:
For an in-depth analysis of features and price, visit our React chart controls comparison.

SpreadJS by MESCIUS is a high-performance JavaScript spreadsheet component designed to seamlessly integrate Excel-like functionality into web applications. It empowers developers to deliver robust spreadsheet experiences within their applications, complete with features like data import/export, complex formulas, conditional formatting, and extensive customization options. SpreadJS caters to a wide range of use cases, from financial modeling and data analysis to project management and interactive dashboards, ultimately allowing developers to build feature-rich and user-friendly web applications.
In this blog post, MESCIUS Product Marketing Specialist Mackenzie Albitz demonstrates how to leverage the SpreadJS JavaScript spreadsheet API to effortlessly import and read Excel files from designated URLs. Steps include:
Detailed JavaScript and HTML code is included to help you along.
Read the complete blog and learn how to integrate a spreadsheet component into your web applications without the need for an external program.
SpreadJS is licensed per developer and includes 1 Year Maintenance (major and minor version releases and unlimited support phone calls). SpreadJS requires an Annual or Perpetual Deployment License. The optional Add-ons are available at an additional cost, and require a SpreadJS license. See our SpreadJS licensing page for full details.
For more information, visit our SpreadJS product page.
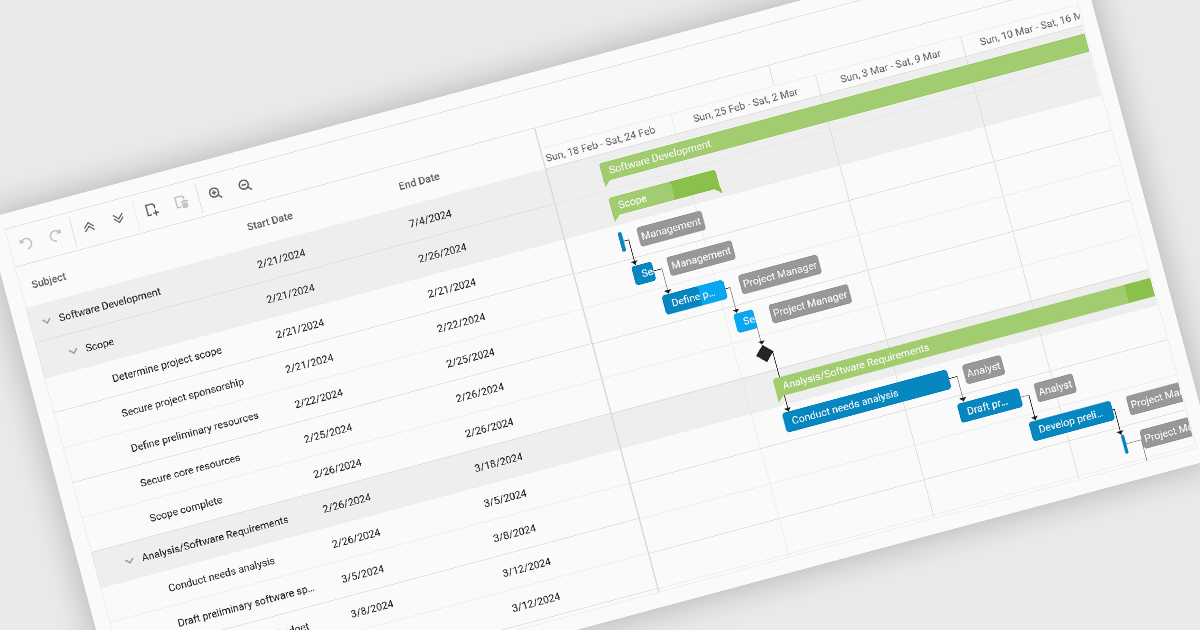
Gantt charts, a specialized type of bar chart, are invaluable tools for project management, particularly in visualizing and tracking the timeline of tasks, dependencies, and progress. These charts are ideal for illustrating project schedules, resource allocation, and critical paths. By providing a clear and concise overview of project milestones, Gantt charts facilitate effective planning, communication, and monitoring, ultimately helping organizations achieve project goals efficiently and on time.
Several React chart controls provide Gantt charts including:
For an in-depth analysis of features and price, visit our React chart controls comparison.
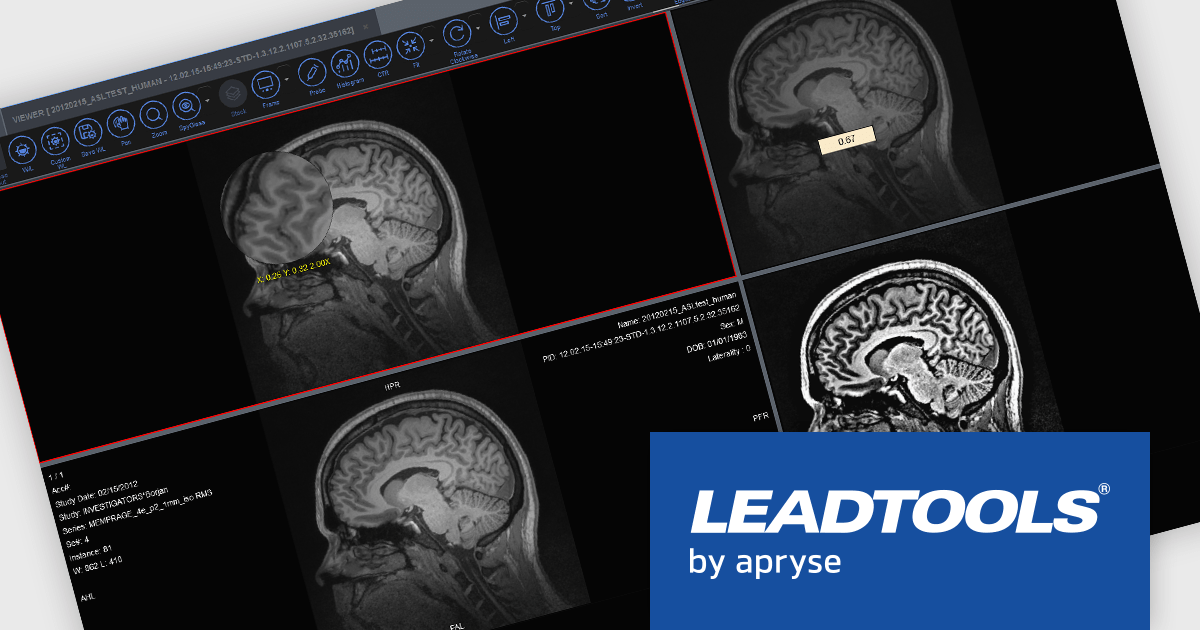
LEADTOOLS Medical SDK is designed to streamline the development of medical applications, offering support for DICOM datasets, 8-16 bit extended grayscale images, and advanced image annotation capabilities. It also includes specialized tools for displaying images, such as window leveling and LUT (Look-Up Table) processing, as well as medical-specific image processing. Additional features include lossless JPEG compression and the ability to process both signed and unsigned image data. The Medical Imaging Suite expands on this functionality with enhanced features, including HTML/JavaScript viewing for web-based medical image access.
LEADTOOLS Medical 3D Volume Rendering libraries enable developers to visualize medical data using techniques like VRT, MIP, MPR, and SSD. These tools provide interactive controls for window levels, zoom, and density adjustments, along with customizable settings for appearance, such as borders and resolution. The libraries enhance performance with cached 3D volumes for faster load times and include advanced features like 3D reference lines and synchronized stack navigation with a 3D cursor, making it a valuable tool for precise and efficient medical imaging applications.
LEADTOOLS Medical SDK is licensed as Development Licenses, for developers to use the SDKs, and Deployment Licenses, for the right to distribute end user solutions. See our LEADTOOLS Medical SDK licensing page for full details.
Learn more on our LEADTOOLS Medical SDK product page and LEADTOOLS Medical Suite SDK product page.
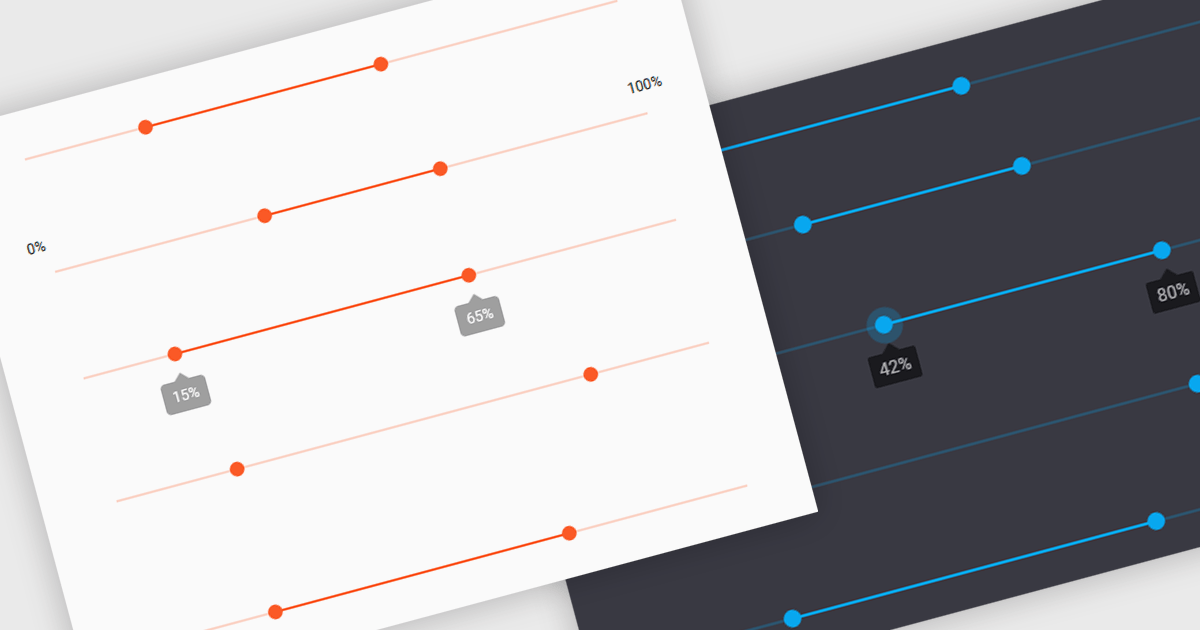
A range trackbar is a UI control that allows users to select a numeric value or a range of values within a predefined minimum and maximum. The range trackbar offers a user-friendly way to adjust values dynamically by dragging a slider, and it can be bound to data using Angular's two-way data binding. This component is particularly beneficial for scenarios where precision control over numeric input is needed, such as setting thresholds, adjusting parameters, or configuring settings, enhancing user interaction and simplifying input collection.
Several Angular Data Editor controls support range trackbars including:
For an in-depth analysis of features and price, visit our comparison of Angular Dada Editor components.
전화 : 00798 14 800 6332
팩스 : +1 770 250 6199


