


공식 공급 업체
200 이상의 소프트웨어 개발처와 판매 계약을 맺은 공인 디스트리뷰터로서 합법적인 라이선스를 제공합니다.
모든 브랜드 보기.

Infragistics Ignite UI for React is a comprehensive UI component library designed to accelerate the development of modern web applications. It offers a rich collection of high-performance, customizable components, including data grids, charts, scheduling, and more. The library's intuitive API and comprehensive documentation make it easy for developers to create visually appealing and interactive user interfaces. Key benefits include improved developer productivity, enhanced application performance, and access to a wide range of pre-built components.
The Ignite UI for React 18.7.0 release adds a new banner component that offers a versatile and effective way to communicate important information to your application's users. By strategically placing banners within your application's layout, you can ensure that crucial messages are prominently visible without obstructing the user's primary workflow. Banners can be customized to include specific actions or calls to action relevant to the message's context, empowering users to respond or take further steps. This flexibility makes banners an invaluable tool for delivering timely and engaging communications within your React-based applications.
To see a full list of what's new in version 18.7.0, see our release notes.
Infragistics Ignite UI for React is part of Infragistics Ignite UI which is licensed per developer and is available as a perpetual license with a 1, 2 or 3 year support and maintenance subscription. See our Infragistics Ignite UI licensing page for full details.
Infragistics Ignite UI for React is available to buy in the following products:
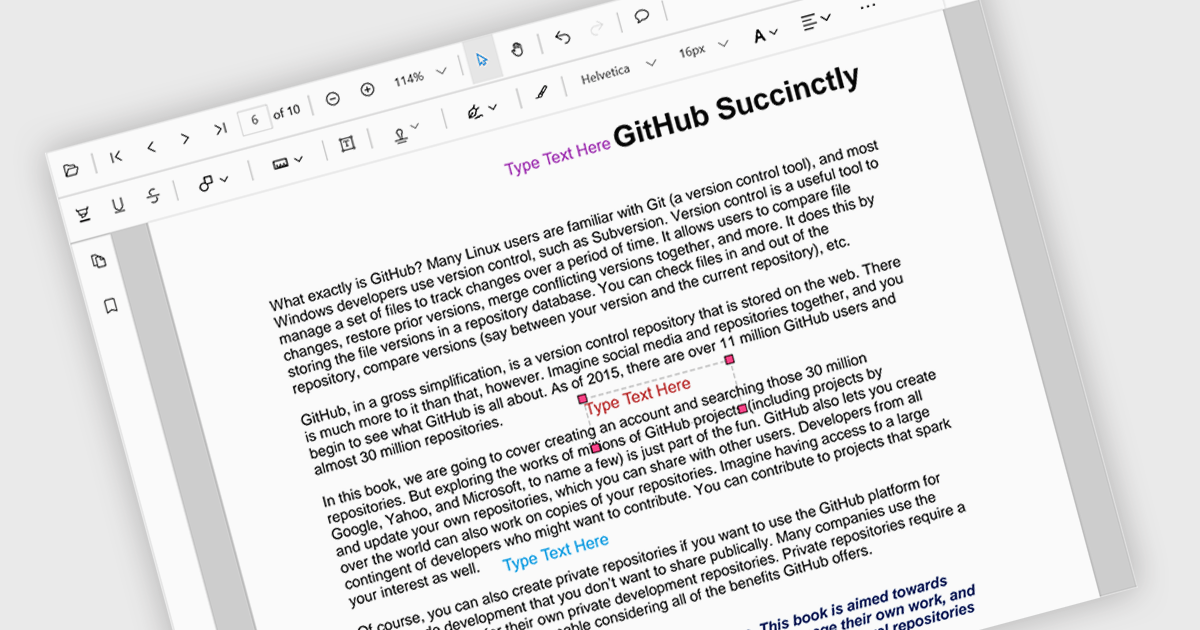
Free text annotations are textual comments or notes added to a document or image, independent of specific fields or structures. Unlike structured annotations that conform to predefined formats (e.g. highlighting, strikethrough), free text annotations provide flexibility for users to express their thoughts, questions, or observations in a more open-ended manner. This allows for richer and more personalized interactions with the content, making it valuable for tasks such as note-taking, research, and collaboration.
Several React PDF viewer controls offer support for free text annotations including:
For an in-depth analysis of features and price, visit our React PDF viewer controls comparison.
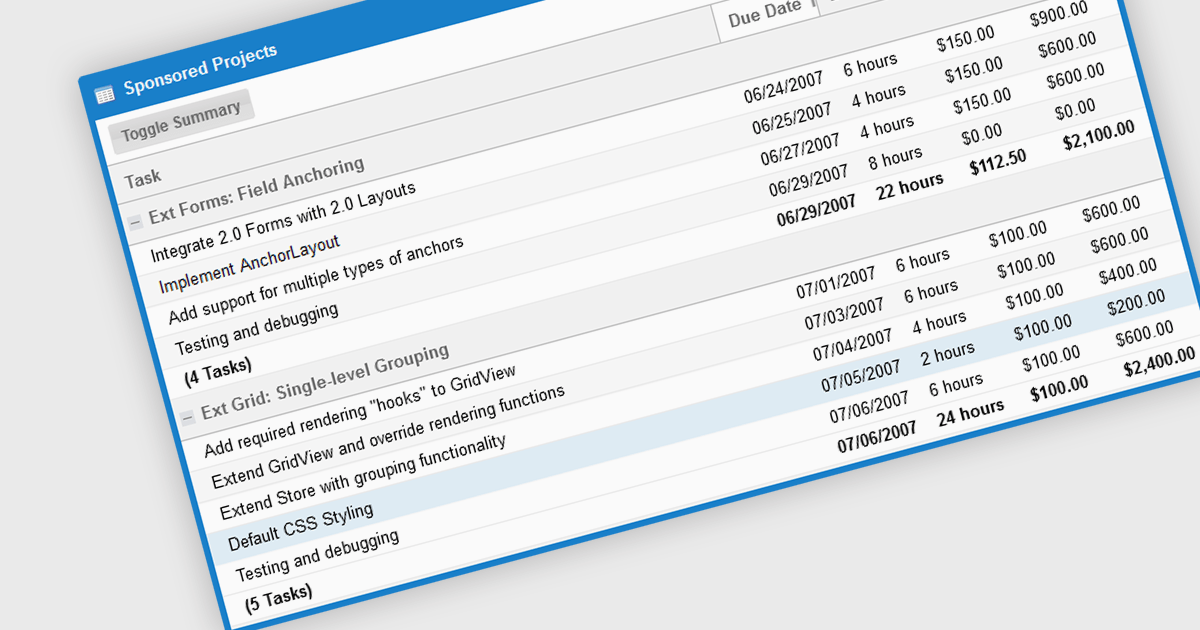
The grouping/summary feature in grid controls enables users to categorize and analyze data effectively by grouping rows based on specific criteria. This functionality allows for the aggregation of data within each group, providing valuable summaries such as totals, averages, counts, and more. By organizing information in a more structured manner, users can gain deeper insights into trends, patterns, and outliers within their data. This feature is particularly useful for large datasets, financial reporting, and data analysis tasks that require a high level of customization and flexibility.
Several JavaScript Grid controls offer grouping / summary support including:
For an in-depth analysis of features and price, visit our comparison of JavaScript grid controls.

Pie charts are circular diagrams that visually represent data as slices of a whole. Each slice represents a category, with its size proportional to its share of the total. They are particularly effective for illustrating categorical data, such as market shares, demographics, or budget allocations. Pie charts offer a clear and intuitive way to compare relative quantities, making it easy to identify the dominant categories and their contributions to the overall composition.
Several React chart controls offer pie charts including:
For an in-depth analysis of features and price, visit our React chart controls comparison.
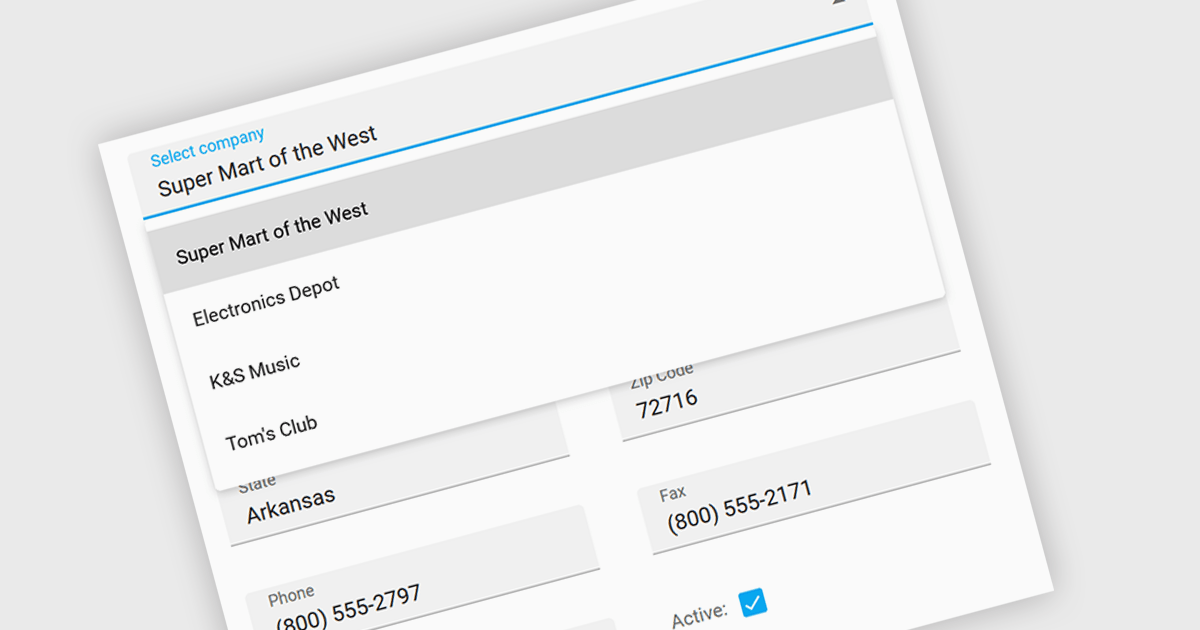
Listboxes are graphical user interface elements that display a list of items from which a user can select one or more. They are commonly used to present options, choices, or data in a compact and organized manner. Their utility lies in their ability to simplify user interaction by providing a clear and visually appealing way to navigate and choose from a predefined set of items, making them essential components in various applications, from simple forms to complex data management systems.
Several jQuery data editor collections can provide you with a listbox including:
For an in-depth analysis of features and price, visit our jQuery data editors comparison.
전화 : 00798 14 800 6332
팩스 : +1 770 250 6199


