













공식 공급 업체
200 이상의 소프트웨어 개발처와 판매 계약을 맺은 공인 디스트리뷰터로서 합법적인 라이선스를 제공합니다.
모든 브랜드 보기.
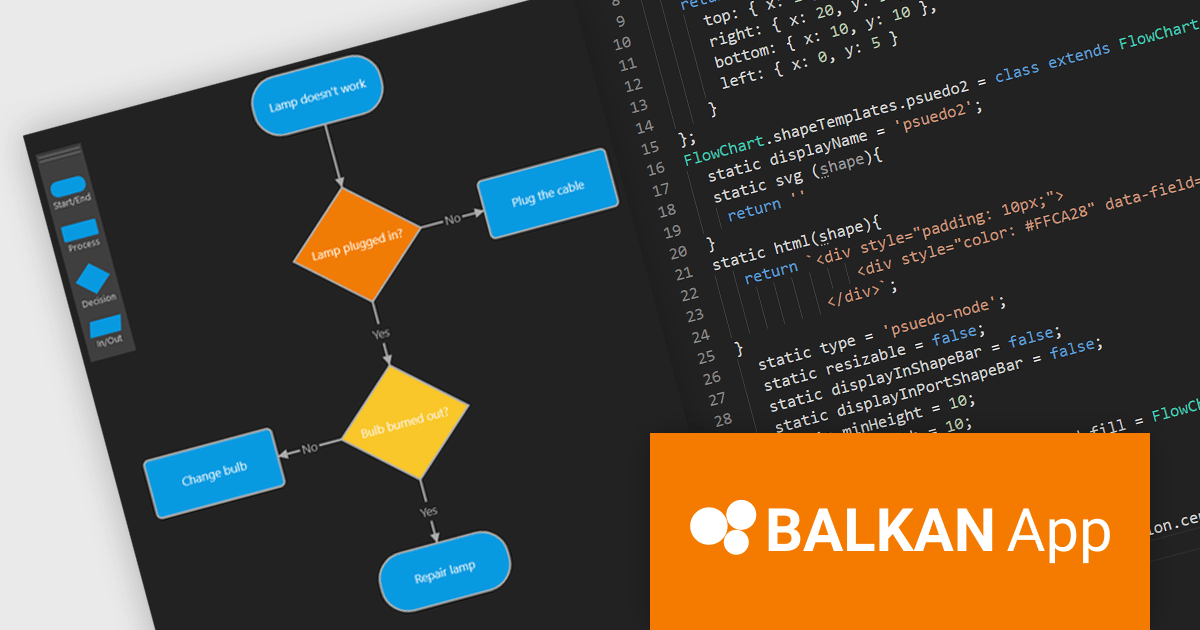
FlowChart JS, a powerful new JavaScript library from BALKAN App, the creators of OrgChart JS, is designed to streamline the creation of interactive and customizable flowcharts. It seamlessly integrates with React, Angular, and Vue.js, offering an intuitive drag-and-drop interface and real-time visual editing, making it easy to visualize complex processes and systems. The library provides a rich set of pre-built shapes and nodes, with the flexibility to create custom shapes, advanced connection and routing options, and a robust API. Its seamless integration into existing applications simplifies the development of clear, structured visualizations.
This new product streamlines the flowchart creation process and enhances visual communication, enabling users to quickly assemble intricate diagrams without extensive coding knowledge. The library's flexibility makes it suitable for a wide range of use cases including business process modeling, software development, educational materials, and technical documentation. By transforming complex information into visually appealing and understandable diagrams, FlowChart JS improves collaboration, decision-making, and problem-solving, providing JavaScript applications with powerful data visualization capabilities.
FlowChart JS is licensed on a perpetual basis with 1 year support and maintenance. Single website, unlimited websites or SaaS, and OEM licenses are available. See our FlowChart JS licensing page for full details.
For more information, see our FlowChart JS product page.

Calculated fields are dynamic values derived from existing data within reporting components. They enable complex data manipulations, calculations, and transformations, providing enhanced data analysis capabilities. By creating new fields based on existing data, calculated fields offer flexibility and efficiency, allowing users to perform calculations, aggregations, and logical comparisons directly within the report. This empowers users to generate insights, visualize trends, and make data-driven decisions without requiring modifications to the underlying data source, ultimately improving report accuracy and usability.
Several Vue.js reporting components offer support for calculated fields:
For an in-depth analysis of features and price, visit Vue.js reporting components comparison.
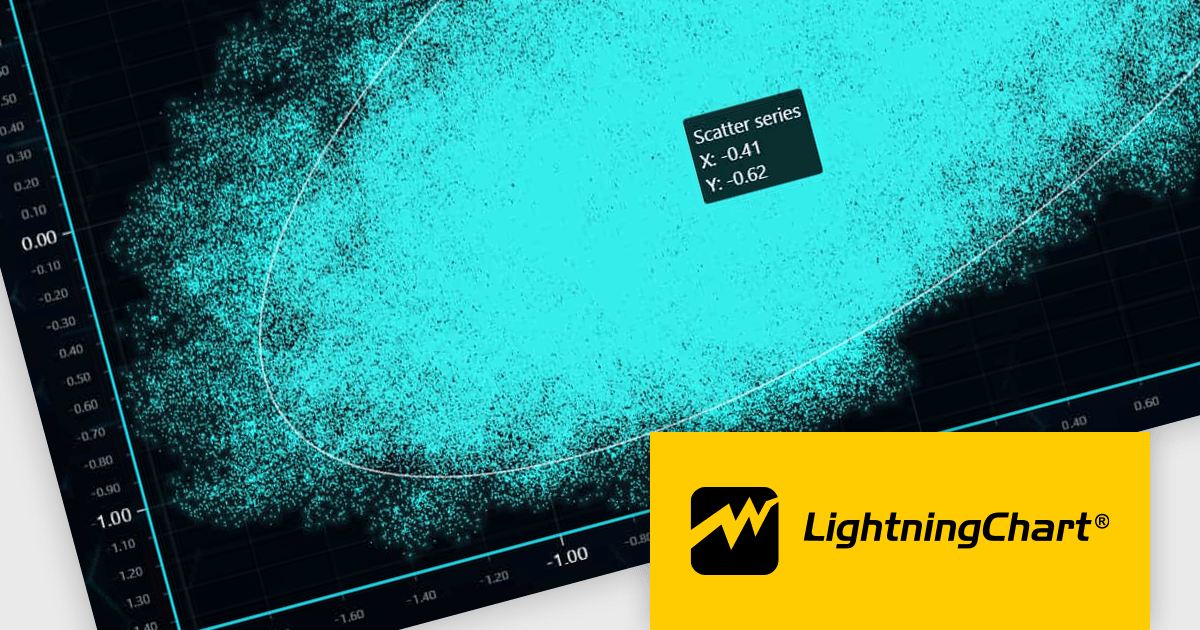
LightningChart JS is a high-performance JavaScript charting library optimized for real-time data visualization. Leveraging WebGL and GPU acceleration, it enables developers to create interactive, complex charts capable of handling massive datasets with high refresh rates. Ideal for applications demanding rapid data updates and smooth interactions, LightningChart JS provides a robust API for customization and integration into web-based projects.
The LightningChart JS v6.0.0 update introduces enhanced cursor capabilities, providing developers with greater control over cursor behavior and appearance. New features include custom cursor shapes, dynamic cursor updates based on data points, and precise cursor positioning, allowing for more informative and interactive visualizations. These improvements facilitate the creation of tailored user experiences and enable developers to effectively convey complex data insights through intuitive cursor interactions.
LightningChart JS v6.0.0 cursor improvements include:
To see a full list of what's new in v6.0.0, see our release notes.
LightningChart JS is licensed based on method of deployment with options including SaaS Developer Licenses, Application Developer Licenses, and Publisher Developer Licenses. Each license is perpetual and includes 1 year subscription for technical support and software updates. See our LightningChart JS licensing page for full details.
Learn more on our LightningChart JS product page.
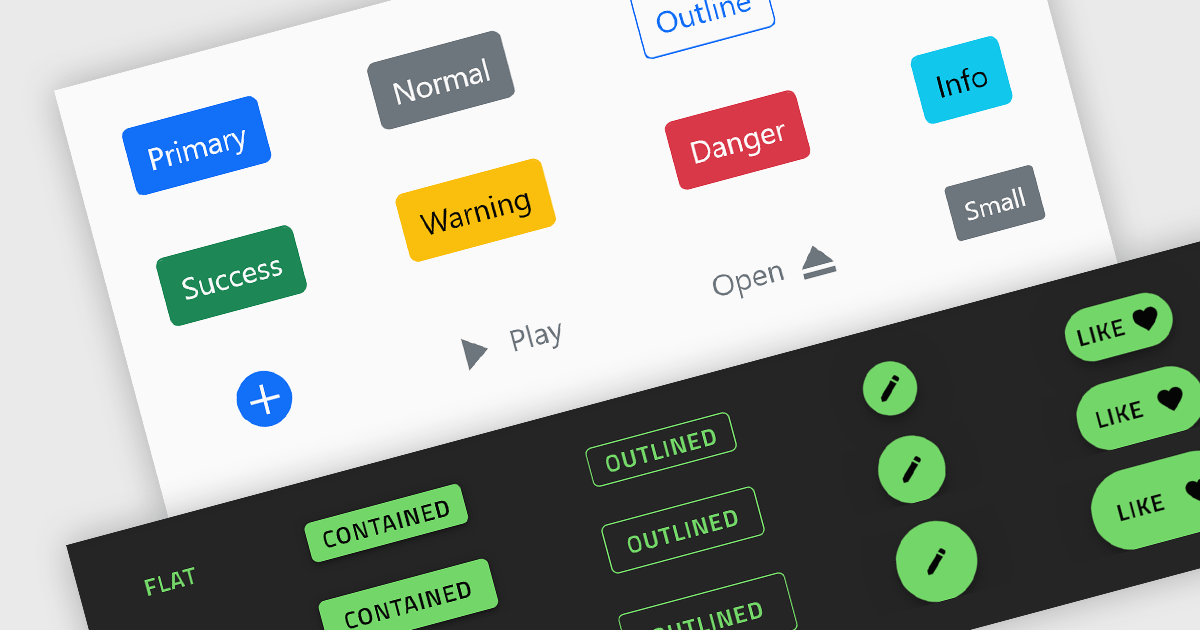
Button controls are specialized tools within design and content management systems that facilitate the creation, customization, and management of buttons. These controls empower users to effortlessly tailor button appearance, size, color, and functionality without requiring coding expertise, streamlining the design process and enhancing user interface consistency across digital platforms.
Several Angular data editor collections offer button editor controls including:
For an in-depth analysis of features and price, visit our Angular Data Editors comparison.
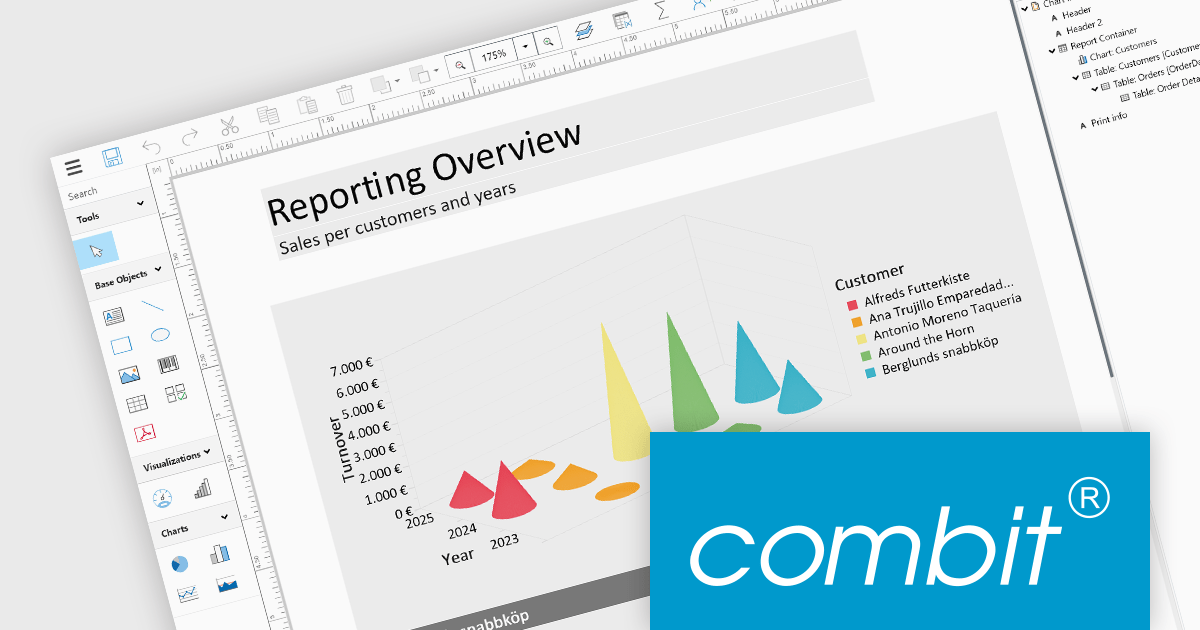
List & Label by combit is a software development toolkit that empowers developers to integrate comprehensive reporting functionalities into their desktop, web, and cloud applications. It offers features such as data binding, complex data visualization, and a user-friendly report designer, along with printing, exporting, and previewing capabilities. List & Label operates independently of programming languages and data sources, providing developers with the flexibility to design and deliver informative reports within their development environment.
The List & Label 29.003 service pack introduces multiple caching mechanisms to optimize performance during operations involving large data structures within the Web Designer. With these mechanisms, the system significantly reduces the frequency of resource-intensive web server requests, thereby decreasing the load on the server. This approach optimizes resource utilization by storing frequently accessed data in temporary storage, thus decreasing the need for repeated data retrieval from the server. The result is faster data processing and improved response times, which is especially beneficial when handling complex design scenarios that demand extensive data processing.
To see a full list of what's new in 29.003, see our release notes.
List & Label is licensed per developer and is available as a Perpetual License with a 12 month support and maintenance subscription. See our List & Label licensing page for full details.
List & Label is available in the following products:
전화 : 00798 14 800 6332
팩스 : +1 770 250 6199


