


공식 공급 업체
200 이상의 소프트웨어 개발처와 판매 계약을 맺은 공인 디스트리뷰터로서 합법적인 라이선스를 제공합니다.
모든 브랜드 보기.
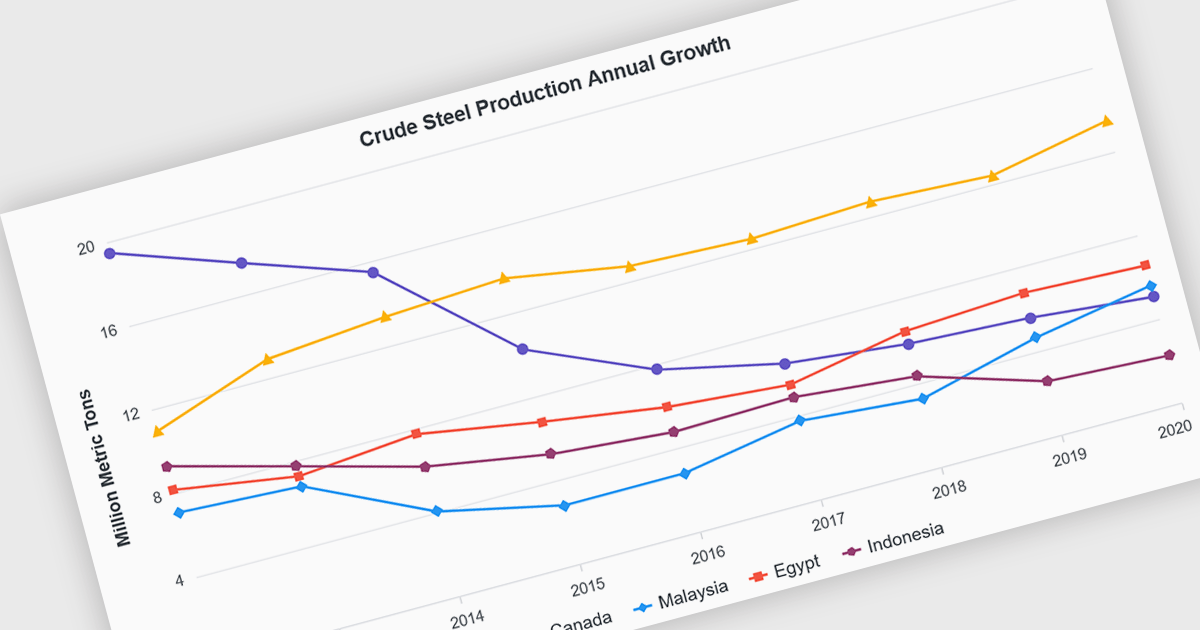
Line charts are visual representations of data points connected by lines, often used to illustrate trends, patterns, or changes over time. They are particularly effective for displaying continuous data sets, such as stock prices, temperature variations, or sales figures. By connecting data points, line charts provide a clear and intuitive understanding of how values evolve over a specific period. This visual representation aids in identifying trends, making comparisons, and predicting future outcomes.
Several Blazor chart controls offer line charts including:
For an in-depth analysis of features and price, visit our Blazor chart controls comparison.
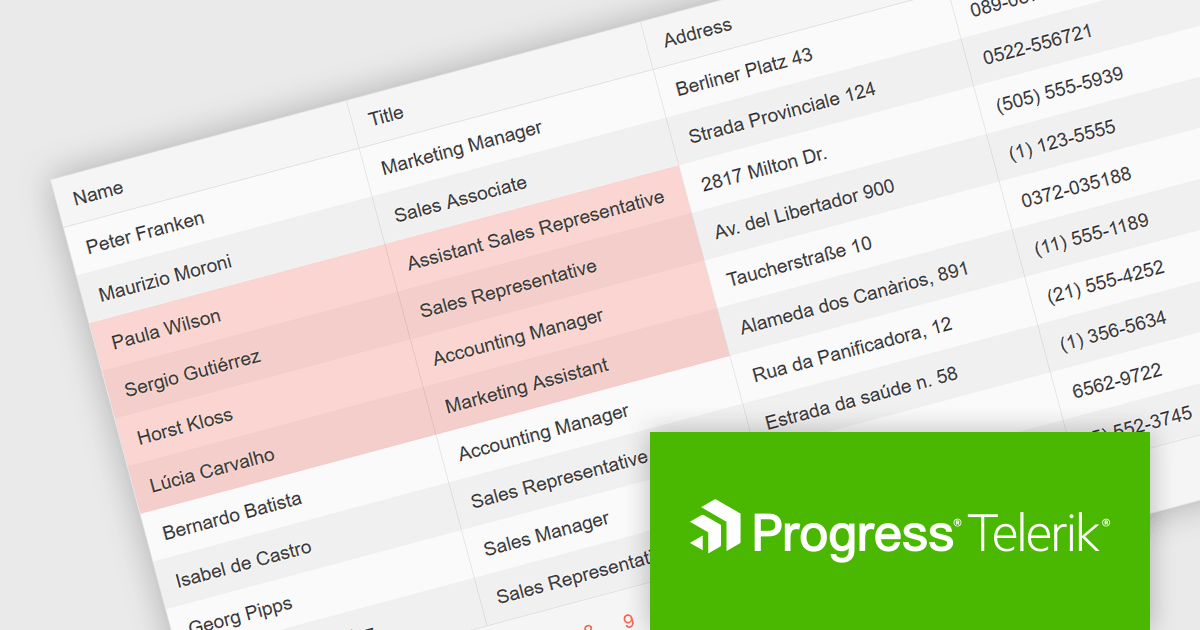
Telerik UI for Blazor is a comprehensive UI library that provides over 110 native Blazor components for building modern and feature-rich web applications. This professional-grade solution offers a complete set of components to satisfy all user interface requirements, saving time and effort in UI design.
The Telerik UI for Blazor v6.1.0 update (part of the 2024 Q3 release) enhances the grid component with a new SelectionMode feature, providing the ability to select single or multiple cells simultaneously. It supports intuitive selection methods via keyboard navigation and allows users to easily navigate and select either cells or rows. This feature enhances the user experience and makes the grid more flexible, enabling Blazor developers to offer functionality better suited to meet the complex data manipulation needs of modern web applications.
To see a full list of what's new in 2024 Q3 (v6.1.0), see our release notes.
Telerik UI for Blazor is licensed per developer and is available as a perpetual license with a one year support subscription, which is available in three tiers: Lite, Priority or Ultimate. See our Telerik UI for Blazor licensing page for full details.
Telerik UI for Blazor is available to buy in the following products:

Infragistics Ignite UI for Blazor is a comprehensive UI component library designed specifically for .NET developers building modern web applications with Blazor. It offers a rich set of over 60 components, including performant data grids, interactive charts, and essential UI elements. This allows developers to craft visually appealing, feature-packed Blazor applications with a focus on data visualization, user interaction, and a variety of design themes.
The Ignite UI for Blazor 24.1 release introduces the the 'HighlightingMode' property to the treemap control. This feature empowers developers to customize how treemap items respond to mouse-over events. The 'Brighten' options isolates the highlight to the hovered item, while the 'FadeOthers' options subtly dims all other items to accentuate the focused element. To refine the visual experience, developers have control over the animation speed, allowing for smooth and engaging transitions between highlighted and non-highlighted states.
To see a full list of what's new in version 24.1 (23.2.257), see our release notes.
Infragistics Ignite UI for Blazor is part of Infragistics Ignite UI which is licensed per developer and is available as a Perpetual License with a 1, 2 or 3 year support and maintenance subscription. See our Infragistics Ignite UI licensing page for full details.
Infragistics Ignite UI for Blazor is available in the following products:
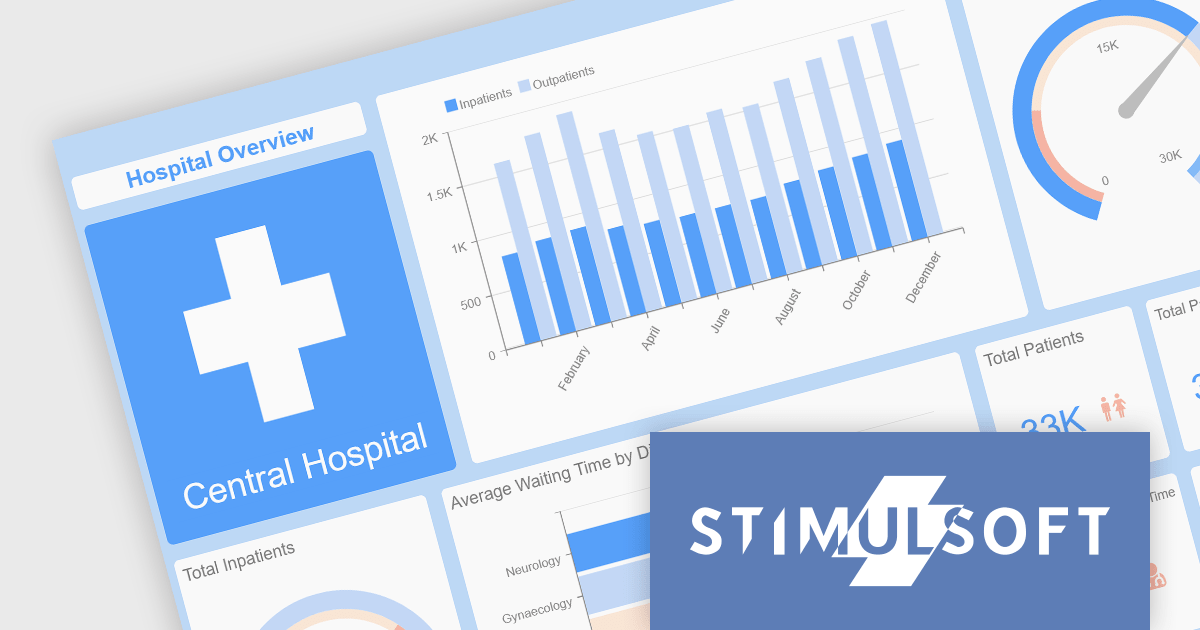
Stimulsoft offers a comprehensive suite of tools for creating interactive data visualizations. Stimulsoft Dashboards excels at crafting engaging dashboards for web and desktop applications, while Stimulsoft BI Designer provides a powerful platform for designing both reports and dashboards. Developers can seamlessly integrate these tools into their projects using platform-specific components or a centralized cloud designer, supporting .NET, JavaScript, PHP, and more. With rich data analysis capabilities, extensive customization options, and pre-built templates, Stimulsoft empowers you to transform complex data into clear, actionable insights for any audience.
The 2024.3.3 release adds a new Scale Mode option when exporting dashboards. This feature enables users to precisely adjust dashboard elements to fit specific output formats, maintain aspect ratios, or optimize for print or digital media.
To see a full list of what's new in 2024.3.3, see our release notes for Ultimate, BI Designer, Dashboards.WEB, and Dashboards.WIN.
Stimulsoft Ultimate is licensed per developer and is available as a Perpetual license with 1 year support and maintenance. See our Stimulsoft Ultimate licensing page for full details.
This update is available in the following products:
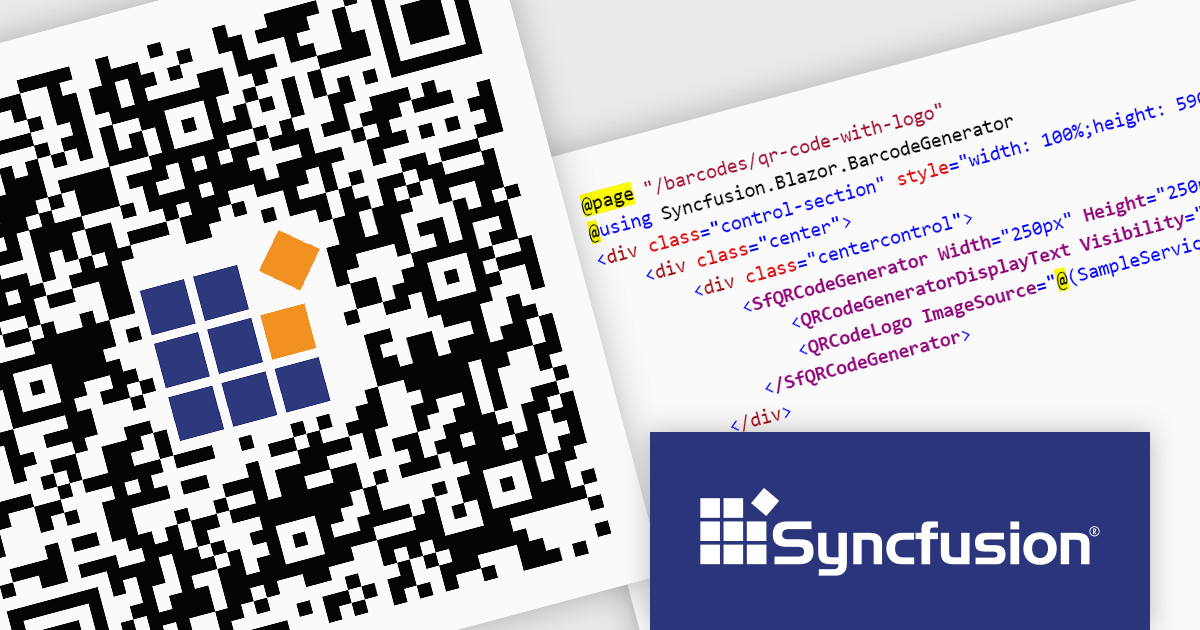
Syncfusion Essential Studio Enterprise provides a comprehensive collection of UI components and frameworks for building modern cross-platform applications. It offers over 1,800 components compatible with .NET WinForms, WPF, ASP.NET Core & MVC, WinUI, MAUI, JavaScript, Xamarin, Blazor, and more, enabling seamless application development across diverse devices and operating systems.
The Syncfusion Essential Studio Enterprise 2024 Volume 2 SP1 (26.2.4) release introduces the ability to embed a custom logo within generated QR codes, empowering businesses to enhance brand recognition and user engagement. By seamlessly integrating company branding into these ubiquitous codes, organizations can create a more distinctive and memorable user experience, fostering stronger brand recall and driving increased interaction with marketing materials and digital content.
To see a full list of what's new in 2024 Volume 2 SP1 (26.2.4), see our release notes for ASP.NET Core, ASP.NET MVC, Blazor, and JavaScript.
Syncfusion Essential Studio ASP.NET Core, ASP.NET MVC, Blazor and JavaScript are available as part of Syncfusion Essential Studio Enterprise which is licensed per developer starting with a Team License of up to five developers. It is available as a 12 Month Timed Subscription License which includes support and maintenance. See our Syncfusion Essential Studio Enterprise licensing page for full details.
Learn more on our ASP.NET Core, ASP.NET MVC, Blazor, and JavaScript product pages.
전화 : 00798 14 800 6332
팩스 : +1 770 250 6199


