


공식 공급 업체
200 이상의 소프트웨어 개발처와 판매 계약을 맺은 공인 디스트리뷰터로서 합법적인 라이선스를 제공합니다.
모든 브랜드 보기.
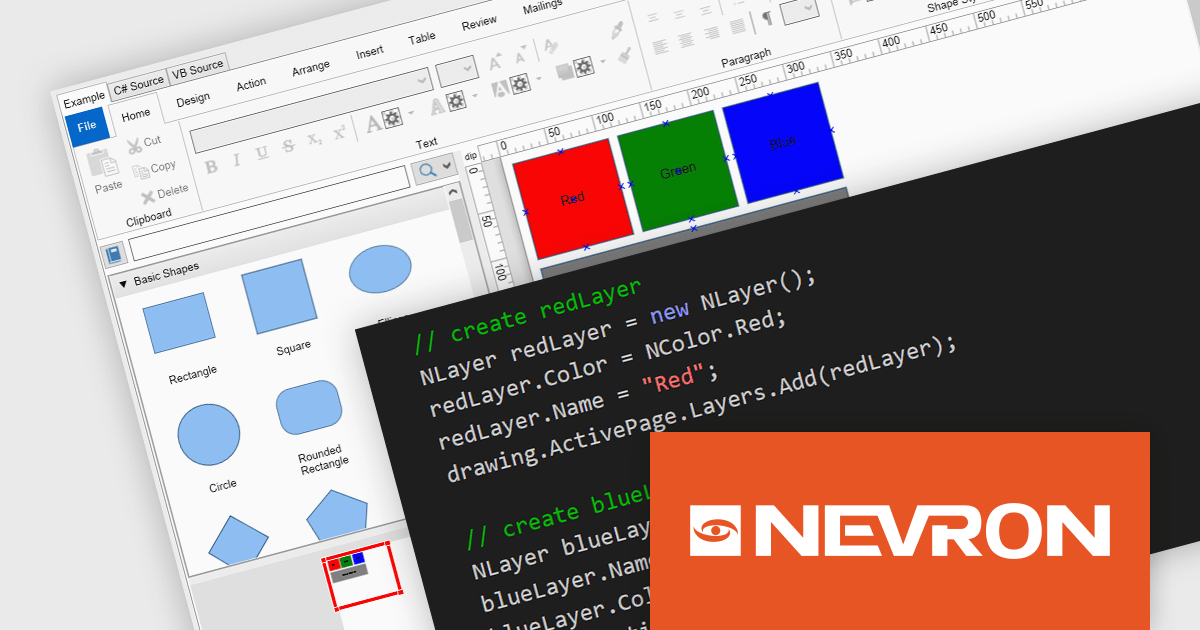
NOV Diagram for .NET by Nevron is a comprehensive and feature-rich diagramming framework designed for .NET developers to create specialized diagramming and drawing applications. Including most of the functionality found in Microsoft Visio, it offers an array of features such as high-performance rendering, a rich set of predefined shapes, automatic layout algorithms, and extensive input/output capabilities. This tool facilitates the integration of complex visualizations directly into WinForms, WPF, Blazor, and Xamarin.Mac projects for developing sophisticated diagramming solutions while maintaining responsiveness and user interactivity.
The NOV Diagram for .NET 2024.1 update introduces a new layers feature which gives developers greater control over complex diagram designs. Enabling the segregation of different visual components into distinct layers allows for better organization, making it easier to manage intricate diagrams that require multiple overlapping elements. This functionality means that each page item can now be assigned to a layer, which can be independently manipulated, hidden, or locked without affecting others. This provides a more streamlined workflow and reduces the likelihood of errors during both development and runtime.
To see a full list of what's new in 2024.1, see our release notes.
NOV Diagram for .NET is licensed per developer and is available as a perpetual license with 1 year support and maintenance. See our NOV Diagram for .NET licensing page for full details.
NOV Diagram for .NET is available in the following products:
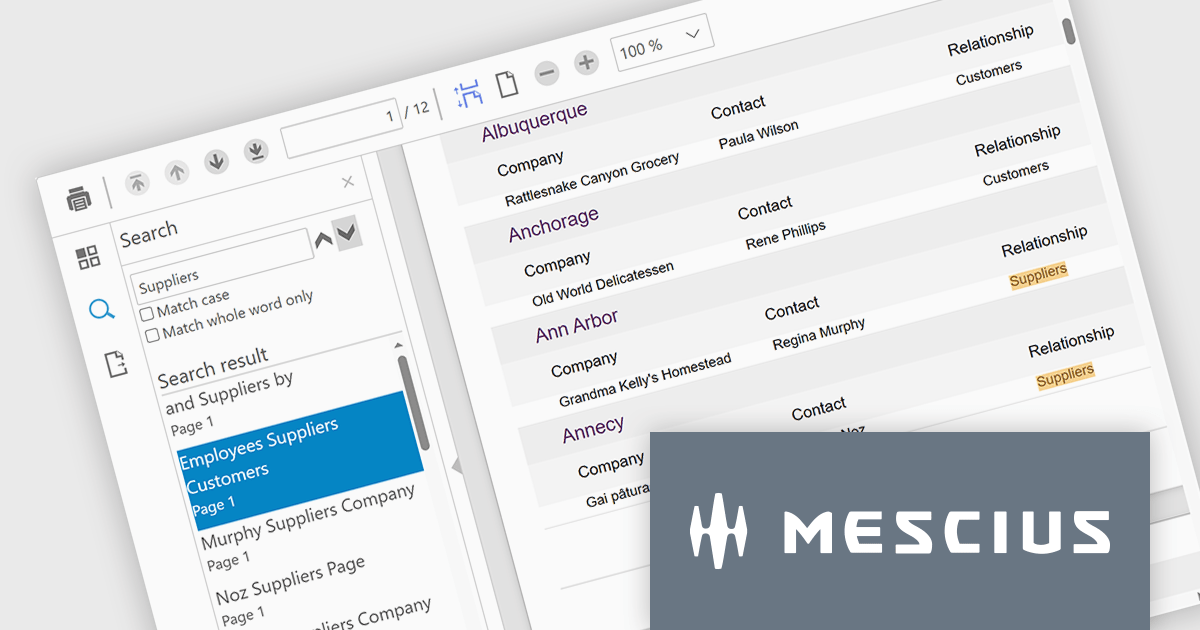
ComponentOne Studio Blazor Edition by MESCIUS empowers developers to leverage their existing C# skills to build rich web applications. This comprehensive suite includes high-performance, native Blazor UI controls like FlexGrid, a powerful datagrid with data virtualization, and 50+ chart types for data visualization. It also offers essential input controls like Autocomplete and Combobox, boosting development efficiency and creating a seamless experience for both developers and users.
The ComponentOne Studio Blazor Edition 2024 v1 release introduces the new FlexViewer control. This Blazor Server control simplifies integrating report and PDF viewing into your Blazor applications. FlexViewer empowers users with intuitive features like page navigation, search, touch support, and continuous scrolling. It also enhances productivity by allowing file export in various formats including PDF, HTML, Excel, Word, and images. This makes FlexViewer ideal for scenarios like delivering financial reports, displaying legal documents, or showcasing product brochures – all within your Blazor applications.
To see a full list of what's new in 2024 v1, see our release notes.
ComponentOne Studio Blazor Edition is licensed per developer on a perpetual basis and includes a 12 month subscription. See our ComponentOne Studio Blazor Edition licensing page for full details.
ComponentOne Studio Blazor Edition is available to buy in the following products:
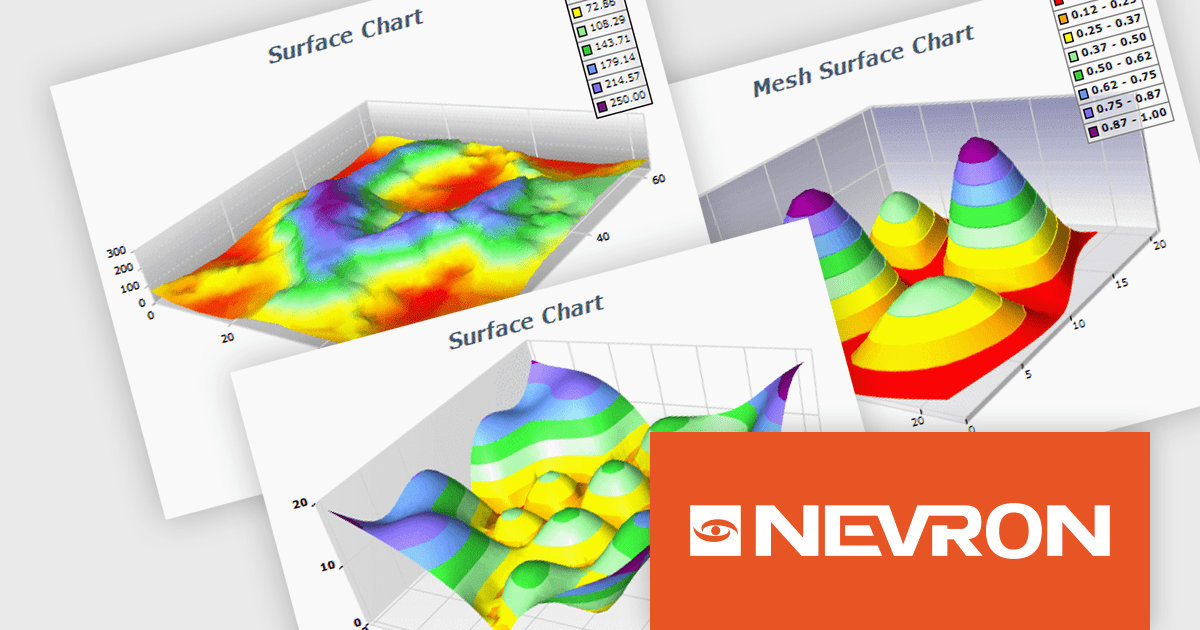
NOV Chart for .NET by Nevron is a comprehensive .NET charting component suite designed for cross-platform application development. It offers an array of 2D and 3D chart types, along with smart data labeling, an advanced chart axes model, numerous interactivity features and GPU-accelerated real-time rendering based on OpenGL. This library allows developers to seamlessly integrate rich, dynamic and interactive business, scientific, financial and presentation data visualizations into their .NET applications for more effective communication.
The NOV Chart for .NET 2024.1 update expands its surface series capabilities to include support for Grid Surface, Mesh Surface, Triangulated Surface, and Vertex Surface series types. Supporting custom colors per vertex, mesh and contour lines, flat contour rendering, real time, shader optimized rendering, and more, each series type offers unique capabilities for depicting data. This enables developers to deliver richer, more informative visual analytics, catering to a wide range of professional and scientific needs.
To see a full list of what's new in 2024.1, see our release notes.
NOV Chart for .NET is licensed per developer and is available as a perpetual license with 1 year support and maintenance. See our NOV Chart for .NET licensing page for full details.
NOV Chart for .NET is available in the following products:
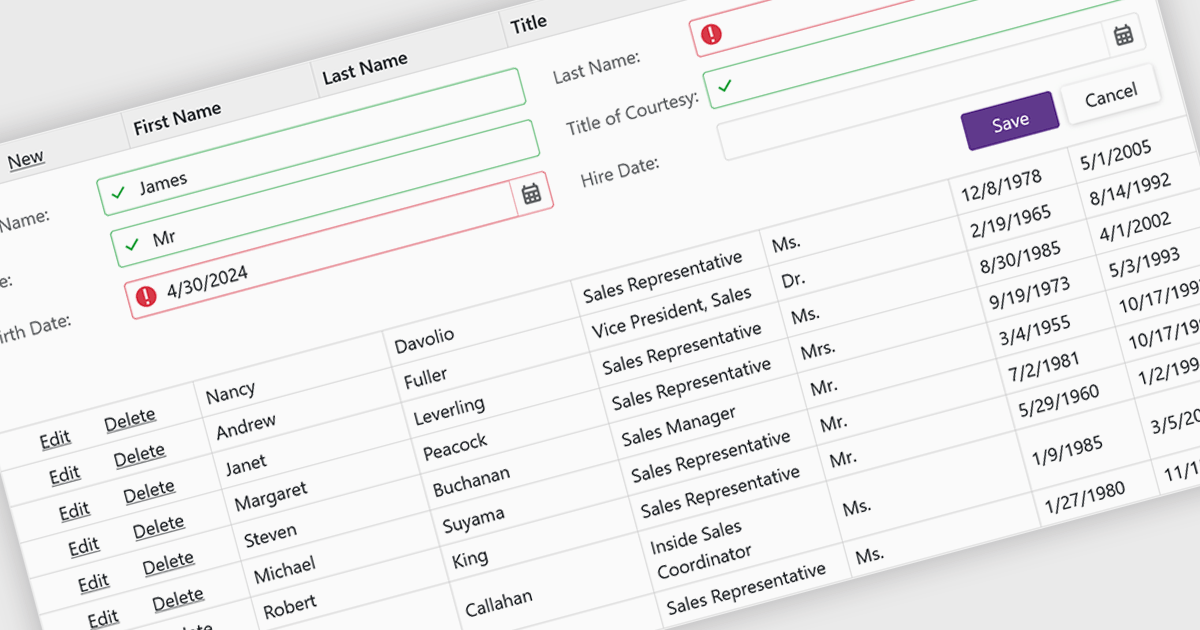
Data validation ensures the accuracy and integrity of information entered by users. It involves implementing rules to verify data against specific criteria, such as data type, format, or range. This helps prevent errors during data entry, improves data consistency, and safeguards against invalid information skewing analysis or downstream processes. Data validation is crucial in various scenarios, including managing financial records, maintaining customer databases, and ensuring data quality for scientific research.
Several Blazor grid controls offer data validation support including:
For an in-depth analysis of features and price, visit our Blazor Grid controls comparison.
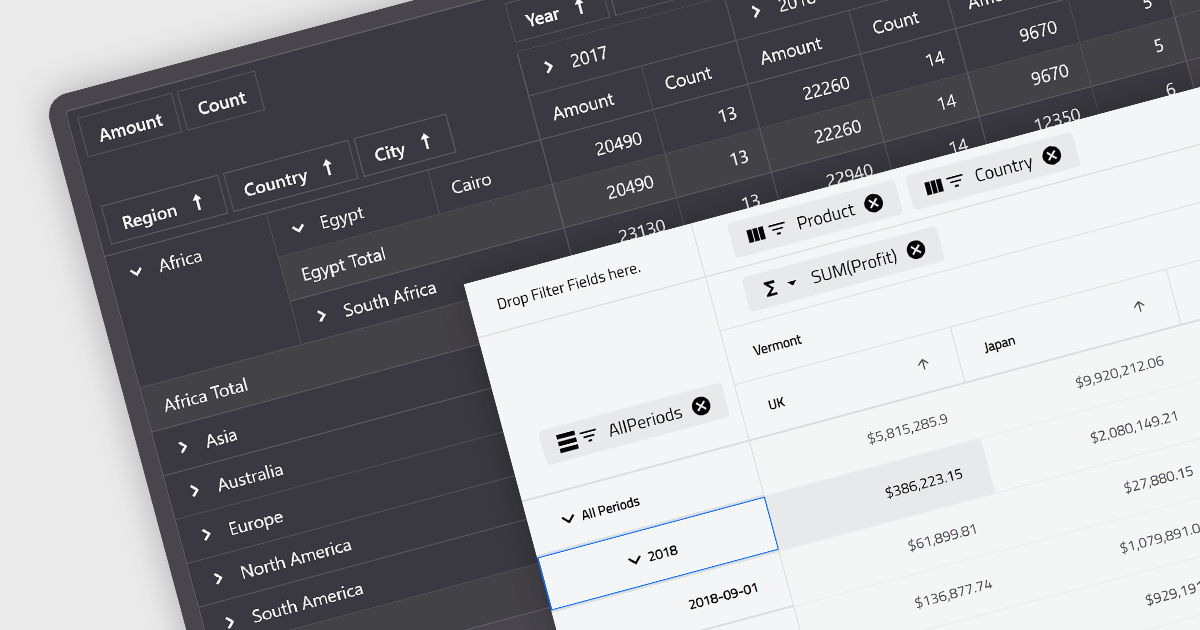
A pivot grid is a powerful data analysis tool that allows you to dynamically summarize and reorganize large datasets. By dragging and dropping fields, you can quickly create a new table that groups and calculates values based on different categories, revealing trends and patterns within your data. This interactive functionality makes pivot grids ideal for gaining insights and informing data-driven decisions. Common use cases include financial analysis, marketing campaign evaluation, and sales performance exploration.
Several Blazor UI suites feature a pivot grid control including:
For an in-depth analysis of features and price, visit our Blazor UI suites comparison.
전화 : 00798 14 800 6332
팩스 : +1 770 250 6199


