


공식 공급 업체
200 이상의 소프트웨어 개발처와 판매 계약을 맺은 공인 디스트리뷰터로서 합법적인 라이선스를 제공합니다.
모든 브랜드 보기.
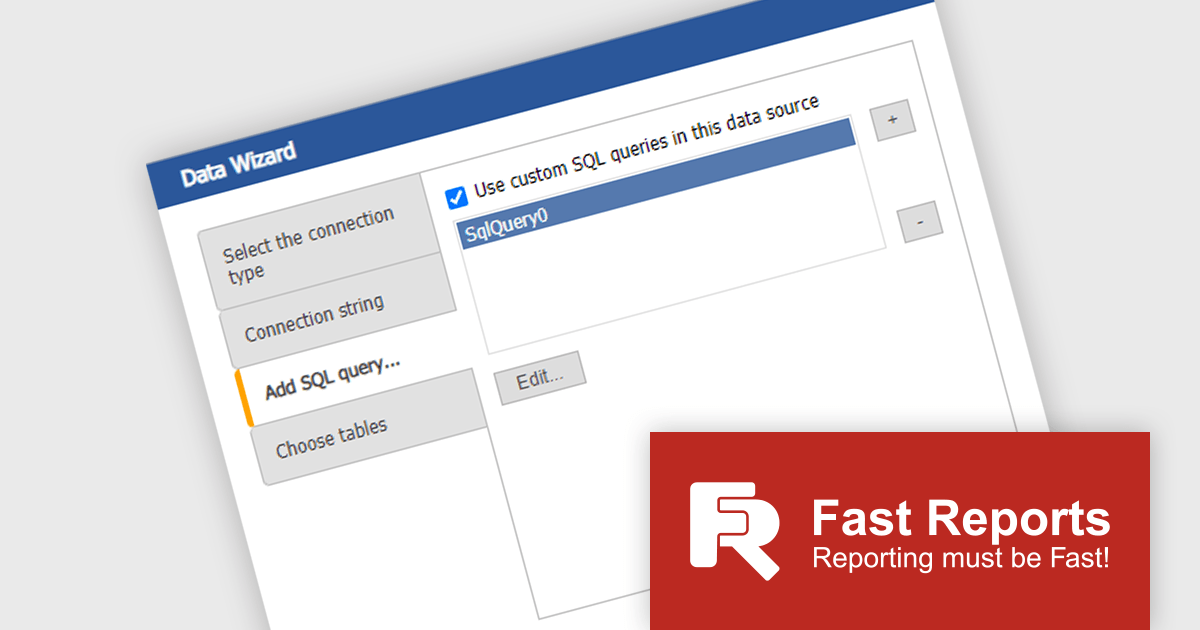
FastReport Online Designer by FastReports is a web-based report designer tool that allows users to create, edit, and view reports directly in their browser on any device. This cross-platform designer integrates seamlessly with FastReport .NET, FastReport Core, and FastReport Open Source, making it a valuable tool for developers who want to empower their end users to customize report layouts and data visualization.
The FastReport Online Designer 2024.2 update introduces Custom SQL Query functionality, which significantly enhances the tool's versatility. It allows developers to write and execute tailored SQL queries directly within the report designer, enabling the integration of complex SQL views and custom data manipulations as standard tables in reports. This capability facilitates more precise data retrieval and manipulation, streamlining the reporting process by reducing the need for pre-processing data externally. Consequently, developers can now create more dynamic, data-rich reports that better meet specific business requirements, ultimately improving the efficiency and effectiveness of reporting solutions within their applications.
To see a full list of what's new in 2024.2, see our release notes.
FastReport Online Designer* is available in a number of license options: SCL may be used in a single application within one organization. SaaS allows embedding within a Cloud platform for your SaaS subscribers. OEM can be integrated into a distributed solution to your customers. Unlimited is also available for custom distributions. See our FastReport Online Designer licensing page for full details.
Learn more on our FastReport Online Designer product page.
* FastReport Online Designer requires FastReport.NET, FastReport Core or FastReport Open Source to work.
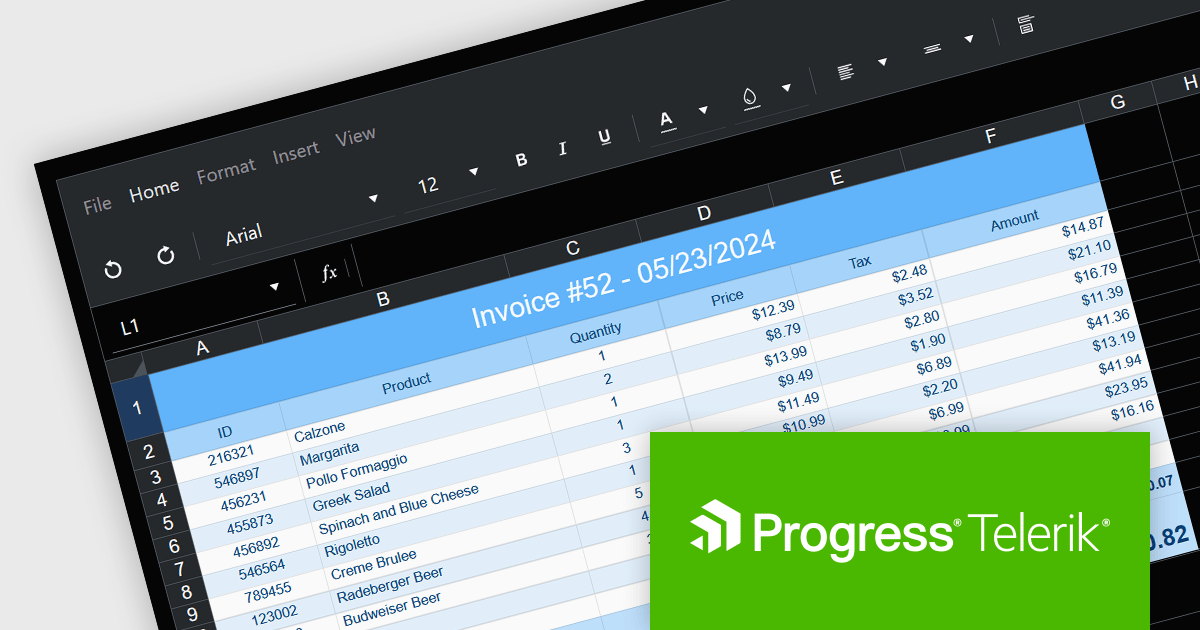
Telerik UI for Blazor is a comprehensive UI library that provides over 110 native Blazor components for building modern and feature-rich web applications. This professional-grade solution offers a complete set of components to satisfy all user interface requirements, saving time and effort in UI design.
The Telerik UI for Blazor v6.0.0 update (part of the 2024 Q2 release) introduces a powerful spreadsheet component, empowering developers to integrate Excel-like functionality seamlessly within Blazor applications. This intuitive interface allows users to view, edit, and manipulate tabular data, complete with formatting options, hyperlink insertion, image embedding, and robust formulas and functions. By eliminating the need for external libraries and streamlining data management through native spreadsheet operations, this update enhances workflow efficiency and application performance.
To see a full list of what's new in 2024 Q2 (v6.0.0), see our release notes.
Telerik UI for Blazor is licensed per developer and is available as a perpetual license with a one year support subscription, which is available in three tiers: Lite, Priority or Ultimate. See our Telerik UI for Blazor licensing page for full details.
Telerik UI for Blazor is available to buy in the following products:
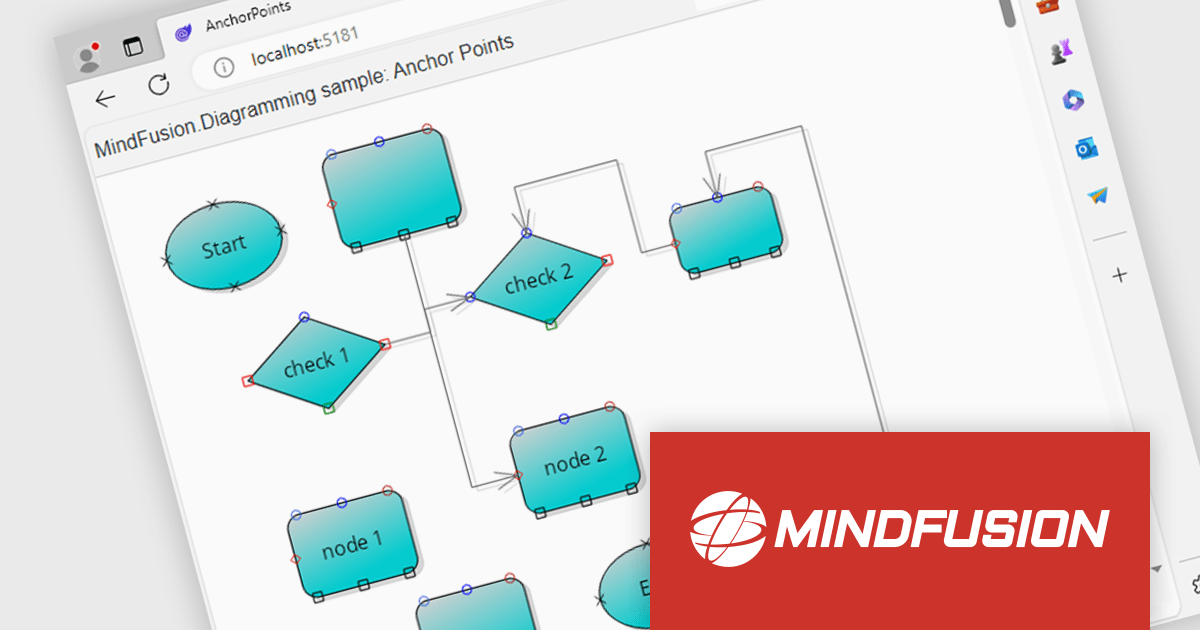
MindFusion.Diagramming for Blazor is a commercial library that empowers you to add interactive diagramming functionalities to your Blazor web applications. It leverages the power of Blazor to seamlessly integrate MindFusion's well-established diagramming capabilities, offering a rich set of features for crafting numerous visual representations.
MindFusion.Diagramming for Blazor empowers you to create a variety of diagrams, including process maps, network architectures, mind maps, and organizational charts. This translates to broader application in fields like project management, software development, and any scenario where visual communication of ideas or data structures is beneficial.
MindFusion.Diagramming for Blazor is licensed per developer and is available as a perpetual license with 1 year subscription and support. See our MindFusion.Diagramming for Blazor licensing page for full details.
MindFusion.Diagramming for Blazor is available in the following products:
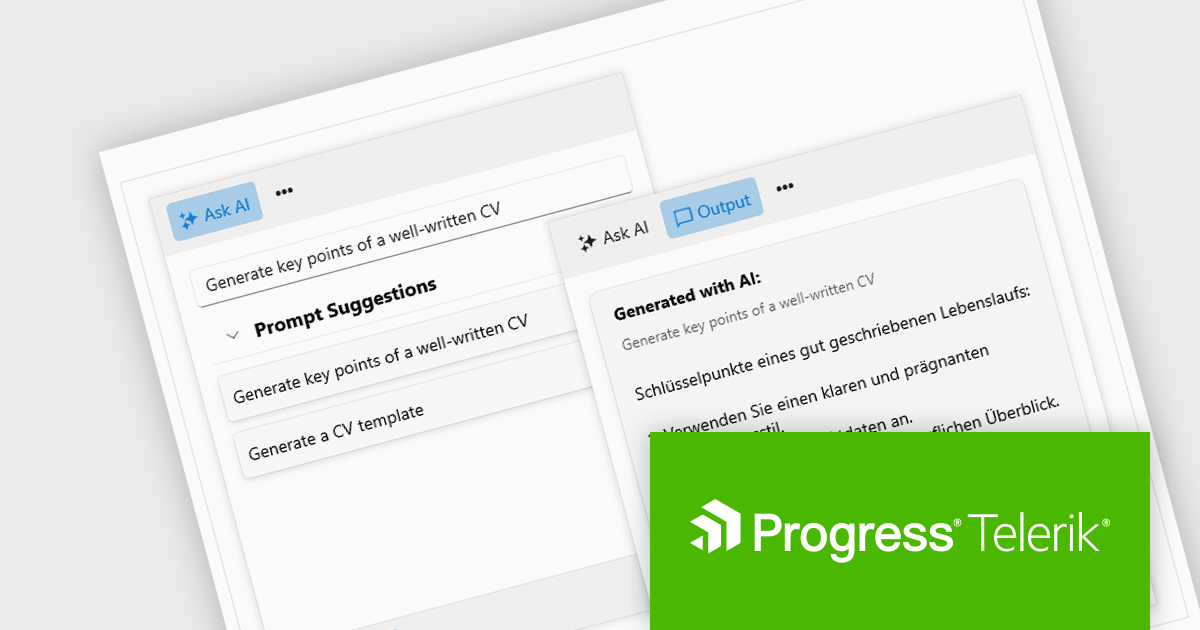
Progress Telerik is a leading software publisher that provides a range of tools and solutions to help developers build and deploy modern applications. Its product range include UI libraries, reporting tools and testing frameworks. Telerik products are used by millions of developers around the world to build a wide variety of applications.
The 2024 Q2 release completes the blending of AI with UI, thereby bridging the gap between an app and next-generation AI language model applications. The new "AIPrompt" component allows you to integrate artificial intelligence prompts into web, mobile and desktop applications, providing users with a modern interface to interact with AI services.
The following Telerik products have been updated with the AI Prompt component:
To see what else is new in 2024 Q2, see our release notes:
Telerik products are licensed per developer and are available as perpetual licenses with a one year support subscription, which is available in three tiers: Lite, Priority or Ultimate. For more information see:
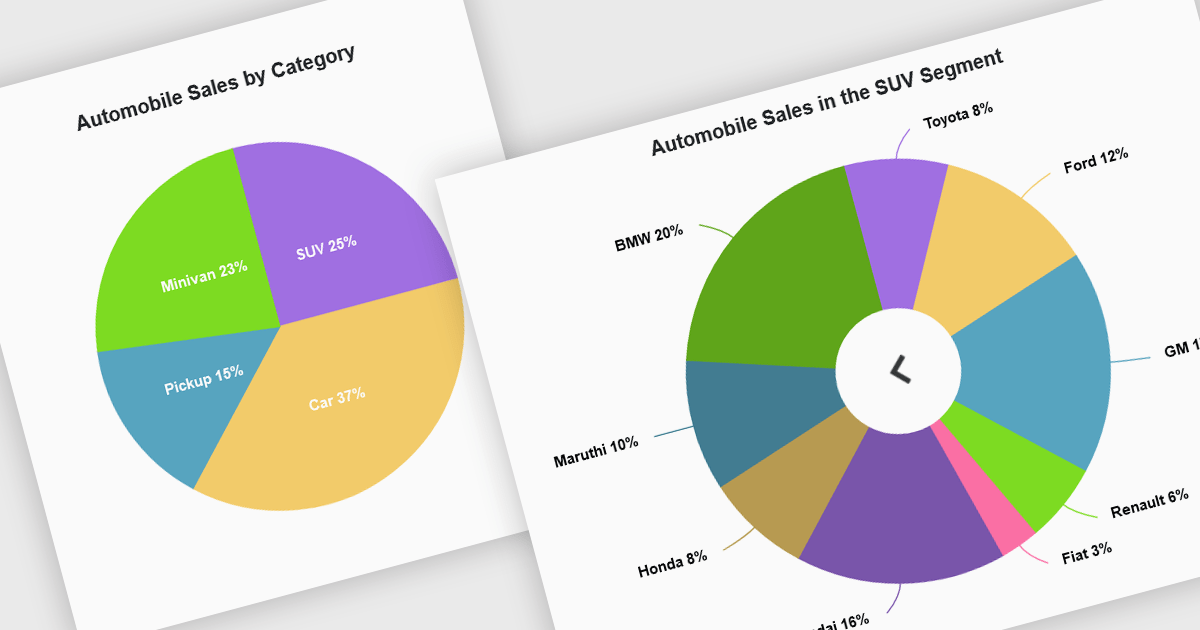
Developers can leverage drill down charts to create interactive data visualizations for exploring hierarchical information. These charts allow users to click on data points, drilling down to progressively more detailed breakdowns. This functionality is often paired with breadcrumb navigation, enabling users to easily track their exploration path and return to higher levels. Drill down charts empower users to gain deeper insights from complex datasets.
Several Blazor Chart controls offer drill down support including:
For an in-depth analysis of features and price, visit our Blazor Chart controls comparison.
전화 : 00798 14 800 6332
팩스 : +1 770 250 6199


