













공식 공급 업체
200 이상의 소프트웨어 개발처와 판매 계약을 맺은 공인 디스트리뷰터로서 합법적인 라이선스를 제공합니다.
모든 브랜드 보기.
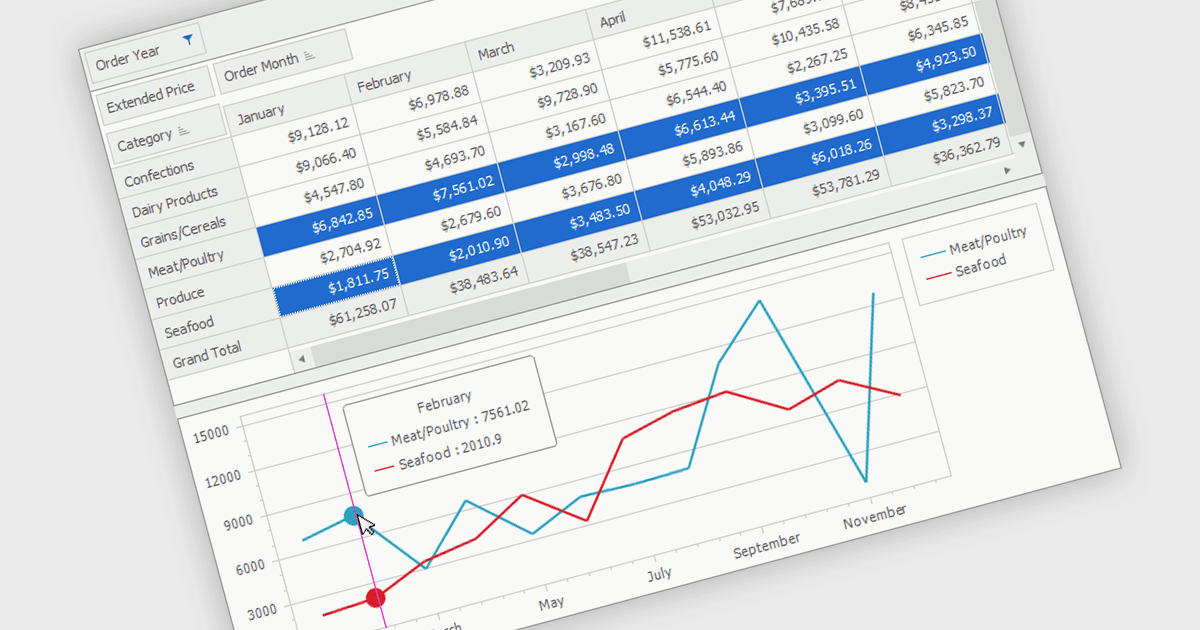
A pivot chart is an interactive data visualization tool that works alongside a pivot table to display summarized data in a graphical format. It enables users to analyze datasets by dynamically changing categories, series, and filters without altering the source data. By presenting trends, comparisons, and patterns visually, pivot charts make complex information easier to interpret and support faster decision making. They are widely used in business intelligence, reporting, and data analysis where flexible exploration of aggregated data is important.
Several .NET WinForms UI suites provide you with pivot chart functionality, including:
For an in-depth analysis of features and price, visit our comparison of .NET WinForms UI suites.
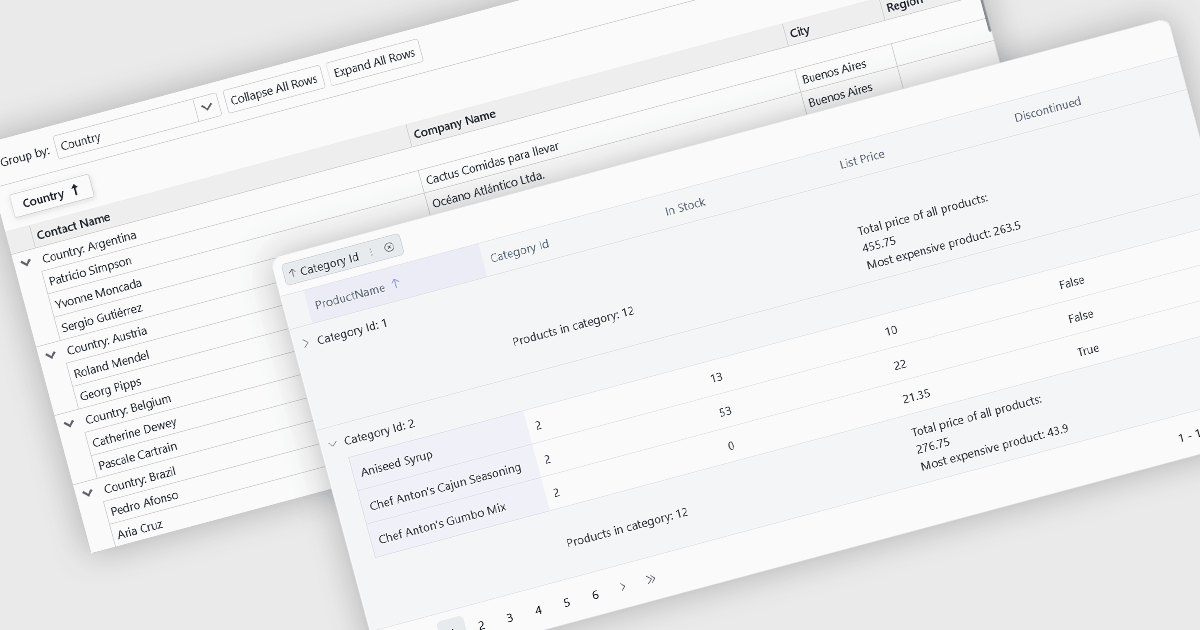
Grouping allows users to organize data by one or more columns, making large datasets easier to navigate and analyze. By collecting related records into expandable groups, it becomes simpler to identify patterns, compare values, and focus on relevant information without manually filtering or sorting the data.
Several Blazor grid controls offer support for grouping including:
For an in-depth analysis of features and price, visit our Blazor grid controls comparison.
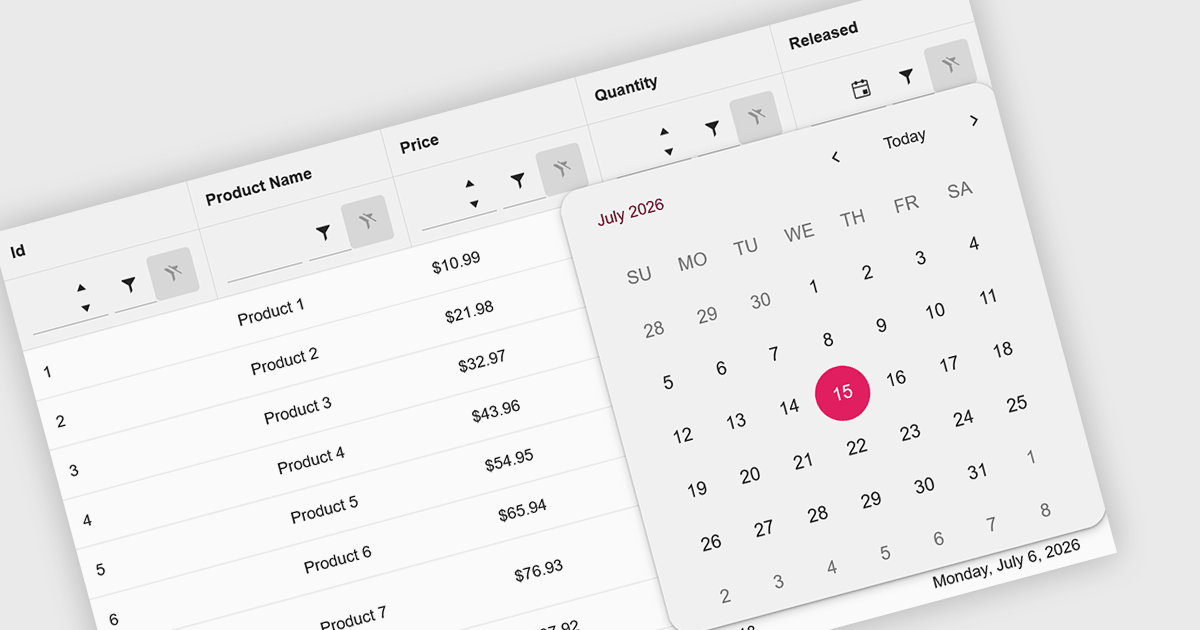
Calendar data entry components provide an integrated date picker that allows users to select dates quickly and accurately instead of entering them manually. This simplifies date input, reduces formatting and typing errors, and creates a more intuitive user experience. By ensuring consistent date values and improving data accuracy, they help developers build more reliable business applications. Common use cases include scheduling appointments, managing project timelines, recording employee leave, booking events, and capturing any information that depends on accurate date selection.
Several .NET Blazor data editor collections offer calendar controls including:
For an in-depth analysis of features and price, visit our comparison of .NET Blazor Data Editors.
DevExpress WinForms is a comprehensive suite of 190+ UI controls and development tools designed for building high-performance desktop applications. It offers a broad array of customizable controls, from data grids and ribbon interfaces to advanced charts, maps, and diagramming components. This empowers developers to rapidly create functionally rich applications, while adhering to accessibility guidelines and touch-enabled technology for modern Windows environments.
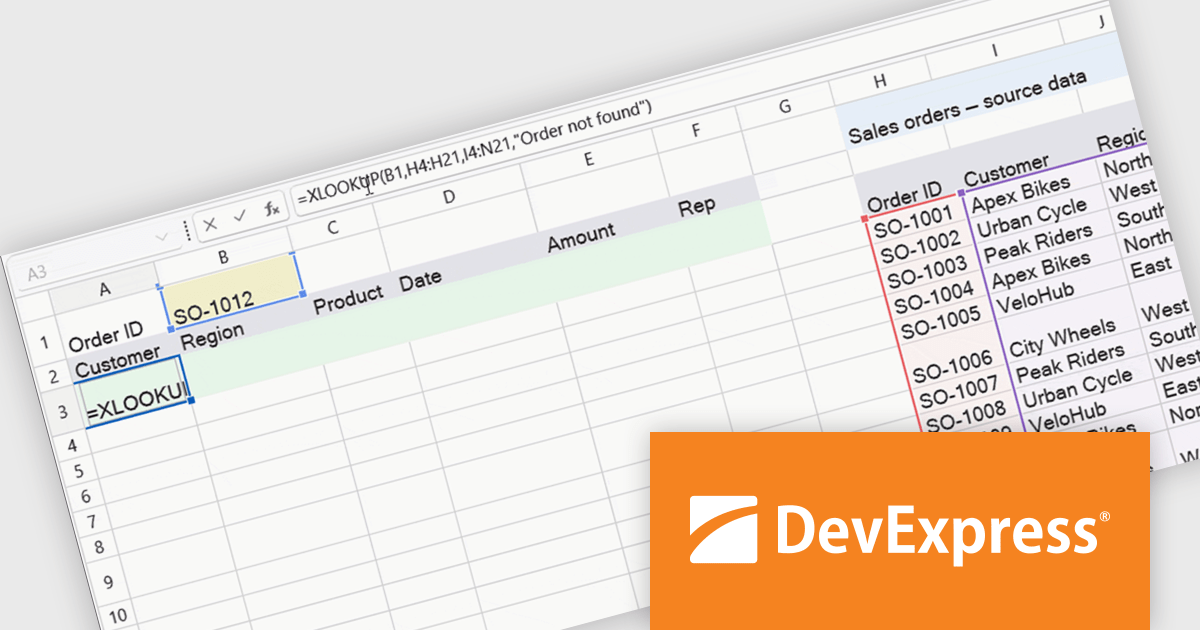
The WinForms Spreadsheet Control in version 26.1 adds support for six new dynamic array-based Microsoft Excel functions: XLOOKUP, XMATCH, SORT, SORTBY, FILTER, and UNIQUE. These additions make it easier to search, sort, filter, and organise spreadsheet data while reducing the need for complex formulas. By matching Microsoft Excel calculation behaviour more closely, the control also helps improve compatibility with existing workbooks and delivers a more familiar experience for users.
To see a full list of what's new in version 26.1, see our release notes.
DevExpress WinForms is licensed per developer and is available as a Perpetual License with a 12 month support and maintenance subscription. See our DevExpress WinForms licensing page for full details.
DevExpress WinForms is available individually or in the following products:

Infragistics Ignite UI for Blazor is a comprehensive UI component library designed specifically for .NET developers building modern web applications with Blazor. It offers a rich set of over 60 components, including performant data grids, interactive charts, and essential UI elements. This allows developers to craft visually appealing, feature-packed Blazor applications with a focus on data visualization, user interaction, and a variety of design themes.
The Ignite UI for Blazor 26.1 release adds a new 'IgbChat' component which introduces a complete chat user interface for Blazor, including message display, user input, reactions, suggestions, typing indicators and support for custom templates. Rather than building each element from scratch, developers can assemble chat experiences using a single component, reducing the amount of UI code required.
To see a full list of what's new in version 26.1, see our release notes.
Infragistics Ignite UI for Blazor is available as part of Infragistics Ignite UI which is licensed per developer and is offered as a Perpetual License with a 1, 2 or 3 year support and maintenance subscription. See our Infragistics Ignite UI licensing page for full details.
Infragistics Ignite UI for Blazor is available in the following products:
전화 : 00798 14 800 6332
팩스 : +1 770 250 6199


