


공식 공급 업체
200 이상의 소프트웨어 개발처와 판매 계약을 맺은 공인 디스트리뷰터로서 합법적인 라이선스를 제공합니다.
모든 브랜드 보기.
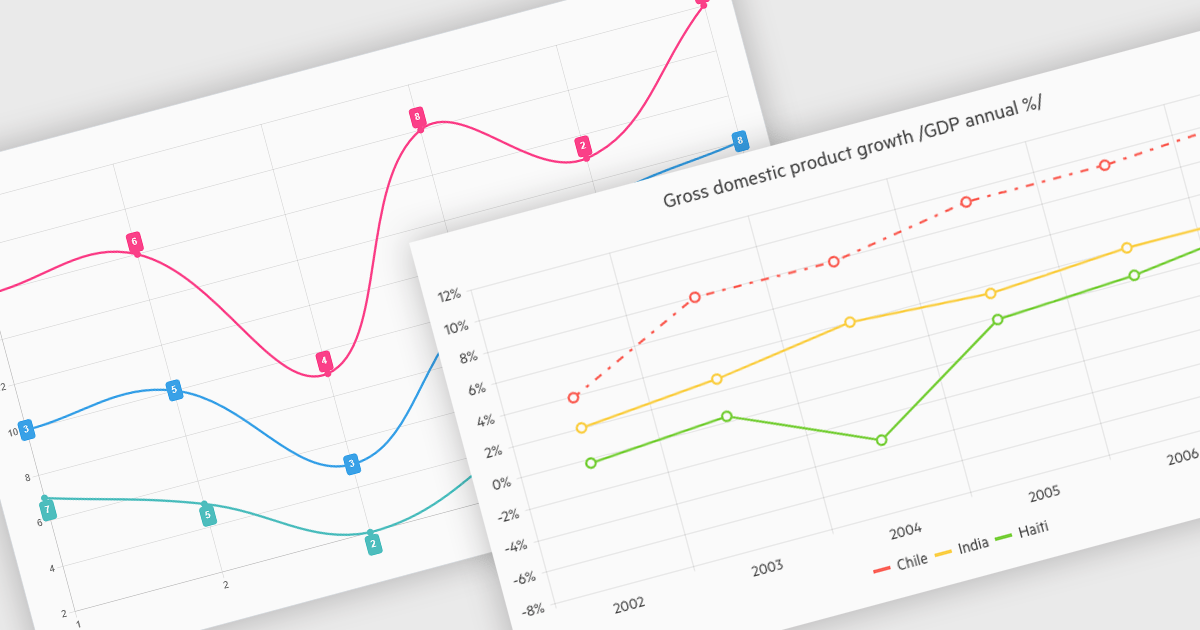
Line charts connect data points with lines to show how values change over a continuous scale, usually time. They make it easy to reveal long-term trends, seasonal patterns and sudden shifts while comparing multiple series on the same axes. Common applications include tracking stock prices, monitoring website traffic, analyzing climate data and comparing regional sales to guide business strategy. By highlighting progression and anomalies without clutter, line charts help turn raw numbers into clear, actionable insights.
Several .NET Blazor Chart Controls offer support for line charts including:
For an in-depth analysis of features and price, visit our comparison of .NET Blazor Chart Controls.
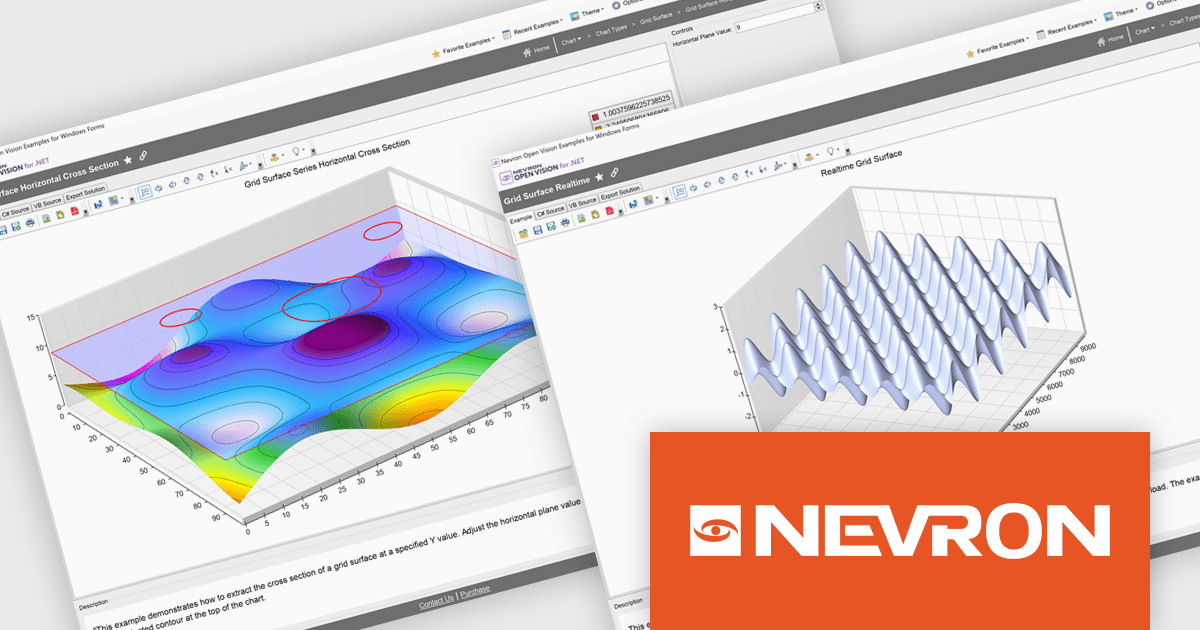
Nevron Open Vision for .NET is a comprehensive cross-platform framework that enables developers to build rich presentation layers from a single codebase supporting Windows, macOS, Android and iOS. It offers an extensive collection of widgets and components including data grids, charting and diagramming so development teams can create modern interfaces without HTML constraints. With built-in virtualization and integration into existing .NET projects, NOV improves development and deployment through single-file executables and reduced boilerplate, making it suitable for enterprise desktop applications, mobile apps and embedded solutions requiring premium-quality UI components.
The Nevron Open Vision for .NET 2025.1 update brings native .NET 9.0 support, enabling developers to leverage the latest runtime improvements for faster startup, reduced memory usage and more efficient garbage collection. By targeting .NET 9.0, NOV components can directly use updated language APIs and benefit from JIT/AOT optimizations without relying on compatibility layers, while still remaining functional on .NET 8.0 and .NET Framework 4.7.2+. This ensures seamless integration with modern tooling in Visual Studio and the .NET CLI, delivers up-to-date security and ultimately allows teams to build and deploy cross-platform applications with greater performance and reliability.
To see a full list of what's new in 2025.1, see our release notes.
Nevron Open Vision for .NET is licensed per developer on a perpetual basis with an optional 12-month subscription for updates and maintenance, and is royalty-free at runtime. See our Nevron Open Vision for .NET licensing page for full details.
For more information, see our Nevron Open Vision for .NET product page.
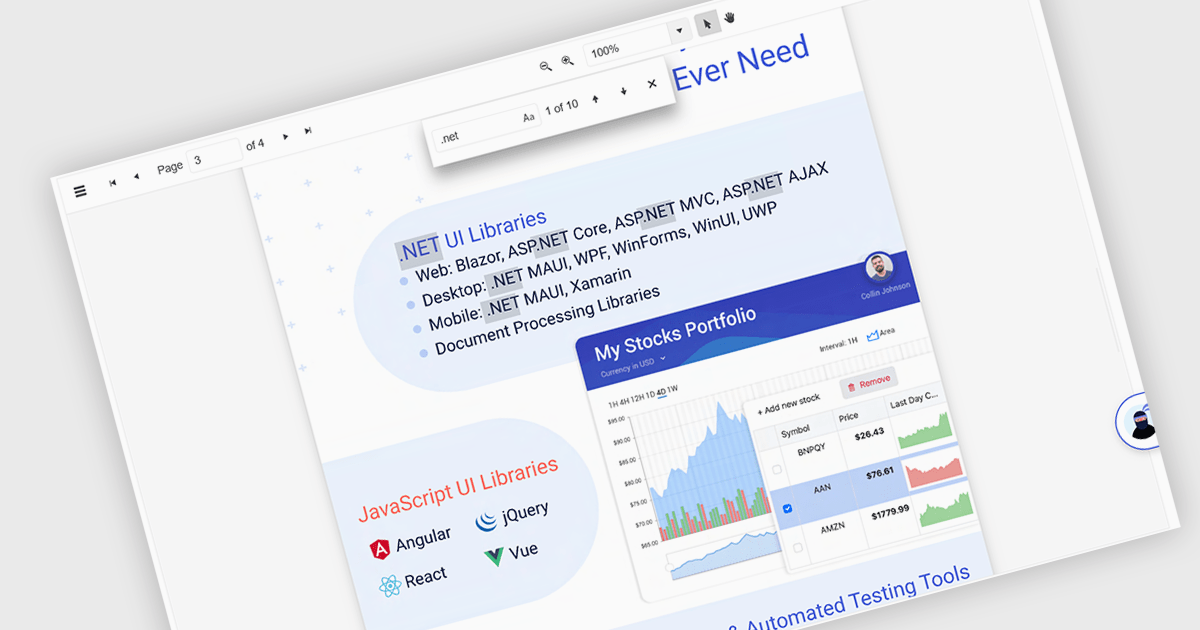
Text Searching in a PDF Viewer .NET Blazor component enables users to locate specific words, terms or phrases within a PDF document. This capability enhances document navigation and accessibility by enabling users to quickly identify and move to relevant content without manually scanning each page. Typically supporting case-sensitive and whole-word matching options, the search can be triggered through UI controls and backend logic, making it a flexible feature for applications that handle large or complex PDF files. This is particularly beneficial for developers building document-heavy applications, as it improves user efficiency and ensures precise content discovery.
Several Blazor PDF Viewers allow users to search for text, including:
For an in-depth analysis of features and price, visit our comparison of Blazor PDF viewers.
Cloud service support in .NET Internet Communication components refers to the integration of cloud-based infrastructure and APIs within applications developed using the .NET platform to handle internet-based data exchange, messaging, and connectivity. These components facilitate seamless interaction with cloud platforms like Microsoft Azure, AWS, or Google Cloud, enabling developers to implement scalable and resilient communication protocols such as HTTP, REST, WebSockets, and gRPC. By abstracting complex networking tasks, they provide benefits such as simplified development, enhanced security, and optimized performance across distributed systems. Common use cases include building cloud-hosted APIs, enabling real-time data feeds in financial applications, managing IoT device communications, and supporting authentication workflows in enterprise apps.
Supported Cloud Services include:
For an in-depth analysis of features and price, visit our .NET communications and messaging components comparison.
ComponentOne Studio Enterprise is a comprehensive suite of .NET UI controls developed by MESCIUS (formerly GrapeCity) designed for building rich, interactive desktop, web, and mobile applications. It provides developers with a broad range of tools and components—including data grids, charts, reports, input controls, and advanced data visualization features—for platforms such as WinForms, WPF, ASP.NET Core, Blazor, WinUI, and .NET MAUI. The suite emphasizes performance, flexibility, and ease of integration, helping teams create consistent, feature-rich user experiences across multiple application types while maintaining a unified development approach.
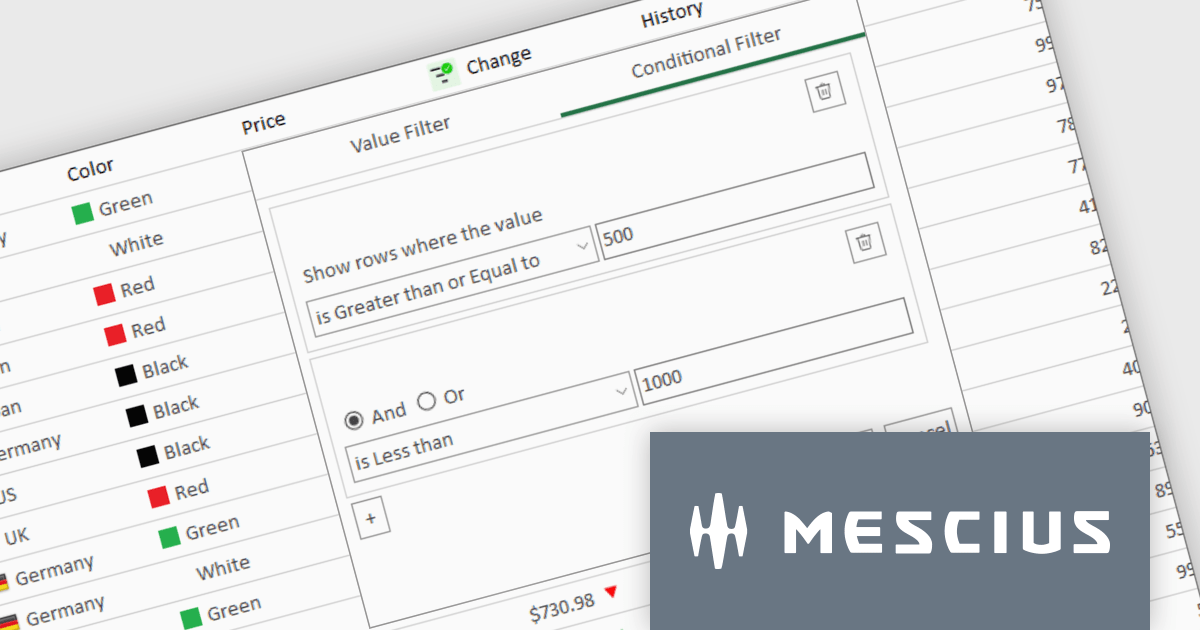
The ComponentOne Studio Enterprise 2025 v1 update introduces a redesigned column filter UI for FlexGrid in WinForms that enhances filtering precision and developer control. It supports a wider range of filter conditions, such as numeric and date ranges, duplicates, and null values, allowing for more refined data manipulation. The new interface aligns visually with modern application themes and remains backward compatible, ensuring that existing codebases can adopt the update without disruption. This improvement enables developers to implement more robust and flexible data grids in their WinForms applications.
To see a full list of what's new in 2025 v1, see our release notes.
ComponentOne Studio Enterprise is licensed per developer on a perpetual basis and includes a 12 month subscription. Priority Support is also available. See our ComponentOne Studio Enterprise licensing page for full details.
Learn more on our ComponentOne Studio Enterprise product page.
전화 : 00798 14 800 6332
팩스 : +1 770 250 6199


