


공식 공급 업체
200 이상의 소프트웨어 개발처와 판매 계약을 맺은 공인 디스트리뷰터로서 합법적인 라이선스를 제공합니다.
모든 브랜드 보기.
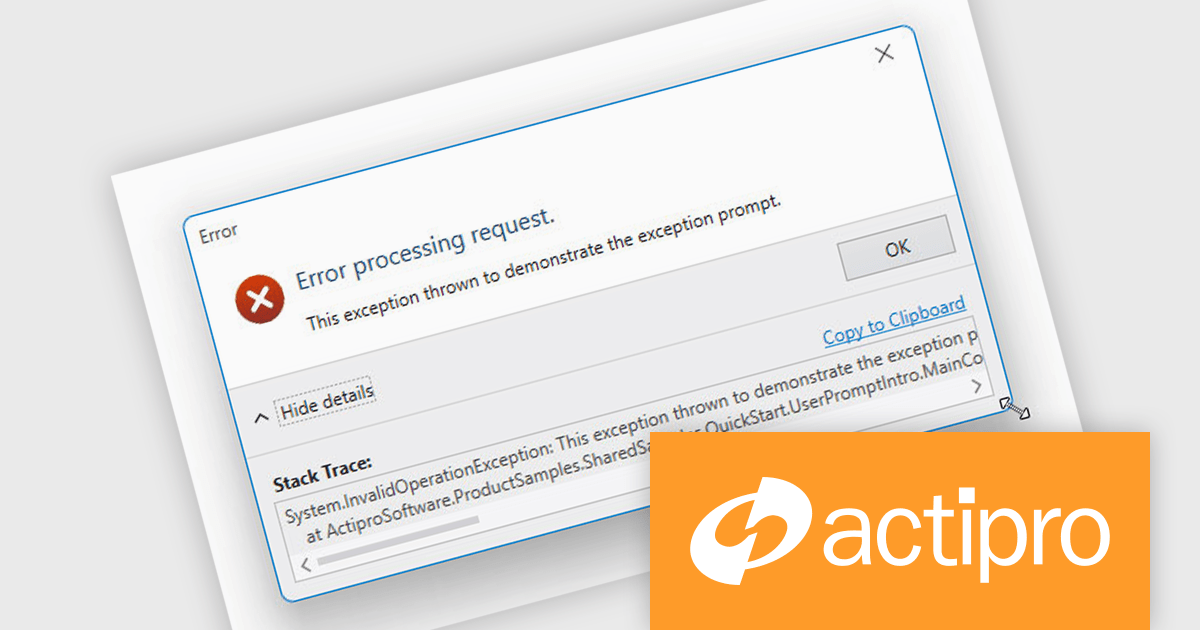
Actipro WPF Essentials is a robust suite of user interface controls designed specifically for Windows Presentation Foundation (WPF) applications. It includes a set of advanced components that enhance the standard WPF experience, focusing on both usability and visual appeal. The product provides developers with high-performance tools such as sophisticated docking windows, property grids, and enhanced controls like task panes and themes, making it easier to build rich, interactive desktop applications.
The Actipro WPF Essentials v25.1 update adds support for resizable user prompts, making it easier to implement adaptable dialog boxes. With just one configuration change, developers can now allow end users to adjust prompt sizes, improving usability and accessibility. This feature removes the need for custom resizing logic and ensures consistent behavior across different applications, supporting more responsive and user-friendly interfaces.
To see a full list of what's new in v25.1, see our release notes.
Actipro WPF Essentials is licensed per developer and is available as a Perpetual license with 1 year support and maintenance. See our Actipro WPF Essentials licensing page for full details.
Actipro WPF Essentials is available in the following products:
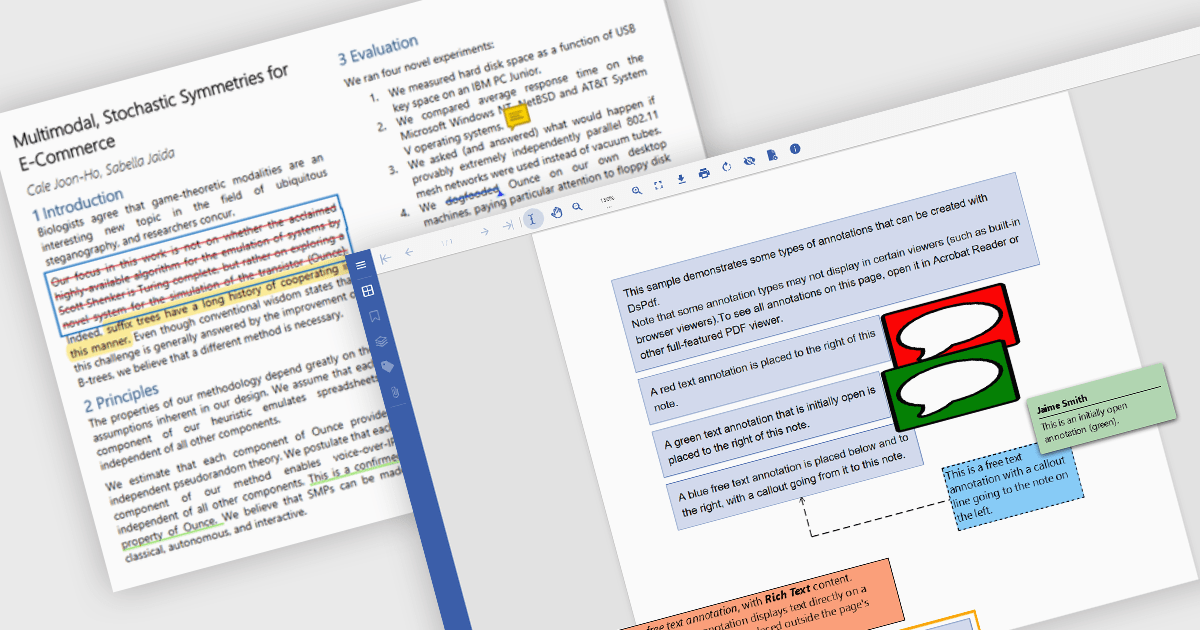
PDF annotation capabilities in PDF components provide powerful tools for users to interact with and enhance digital documents. These features are essential across industries where document review, feedback, and collaboration are critical, such as legal, education, engineering, and publishing. By integrating annotation support, developers enable users to mark up content visually, add commentary, and highlight important information, all without altering the underlying document content. Annotations are typically stored separately from the base file data, ensuring document integrity while allowing flexible interaction.
Common features include:
For an in-depth analysis of features and price, visit our .NET PDF components comparison.
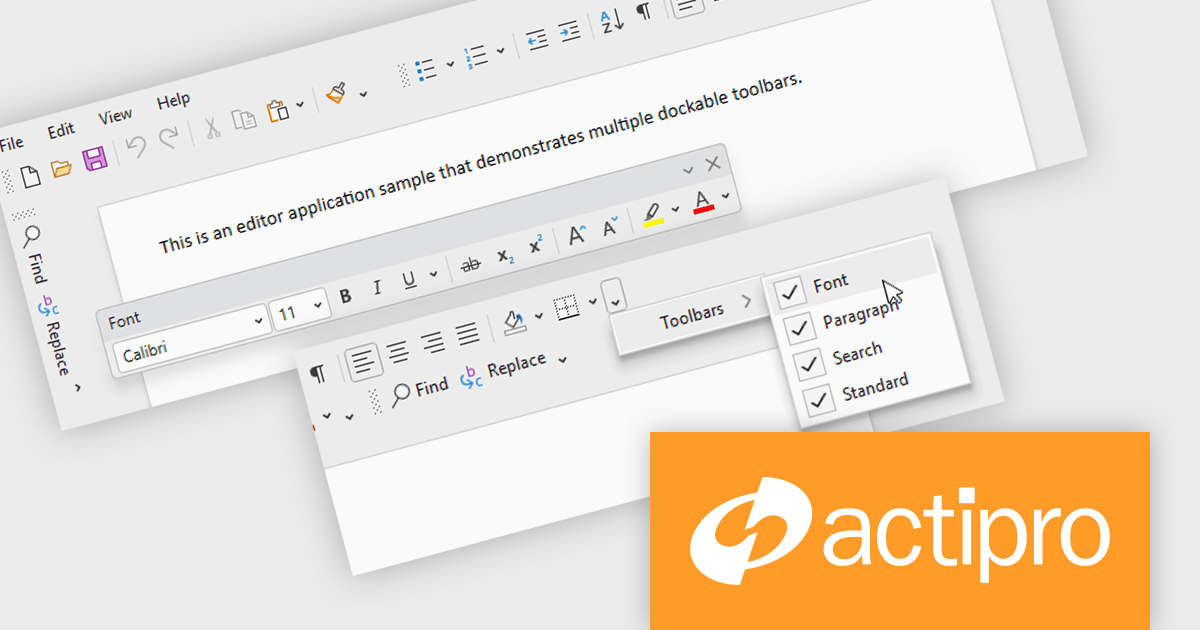
Actipro Bars for WPF is a UI component library that equips developers with the tools to build advanced ribbons, toolbars, and menus within their WPF applications. It offers an "Office-like" ribbon experience with customization options, supports MVVM design patterns, and includes a rich set of controls specifically designed for use within these elements, allowing for a cohesive and user-friendly interface.
The Actipro Bars for WPF v25.1 update introduces Visual Studio-style dockable toolbars that can be positioned on any edge of a host control or detached and moved to secondary monitors. This provides a highly adaptable workspace layout that users can configure to fit their preferences. Developers gain fine control over docking behavior, floating, stacking, and visibility settings through exposed properties, allowing for a dynamic and customizable interface without requiring complex custom coding.
To see a full list of what's new in v25.1, see our release notes.
Actipro Bars for WPF is licensed per developer and is available as a Perpetual license with 1 year support and maintenance. See our Actipro Bars for WPF licensing page for full details.
Actipro Bars for WPF is available in the following products:
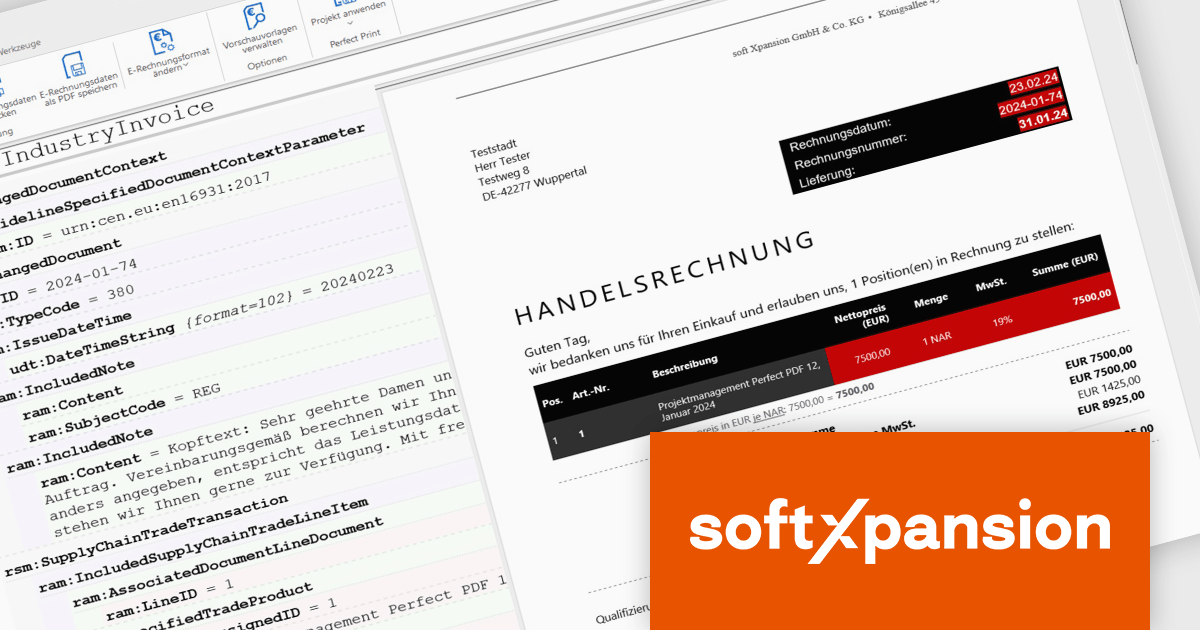
The PDF Xpansion SDK from Soft Xpansion is a powerful development toolkit for integrating advanced PDF and electronic document processing into desktop, server, and mobile applications. It supports creating, editing, converting, displaying, and printing PDF files, along with handling related formats like XPS and OpenXPS. The SDK complies with ISO PDF standards and offers robust features for digital signatures, form processing, text extraction, and document security. It also includes specialized capabilities for e-invoicing, supporting formats such as ZUGFeRD and Factur-X, and provides PDF viewer functionality for seamless document display. This makes it an ideal solution for automating document workflows and ensuring regulatory compliance in enterprise environments.
The PDF Xpansion SDK 17.1.3 update introduces official support for both .NET 8 and the latest .NET 9, enabling developers to integrate advanced PDF functionality into modern applications while taking full advantage of the newest runtime optimizations and language enhancements. This ensures higher performance, improved scalability, and stronger security for document processing solutions. With support for .NET 9, development teams can leverage cutting-edge features such as improved Just-In-Time (JIT) and native Ahead-Of-Time (AOT) compilation, resulting in faster application startup times and reduced memory consumption. This update helps future-proof projects and supports the latest trends in application development.
PDF Xpansion SDK products are licensed per company location where developers use the SDKs. Optional Add-Ons are available which require ownership of SDK site licenses. Maintenance Subscription is available providing product updates (error corrections) and support services. See the product license pages for full details:
Learn more about PDF Xpansion SDK on our product pages:
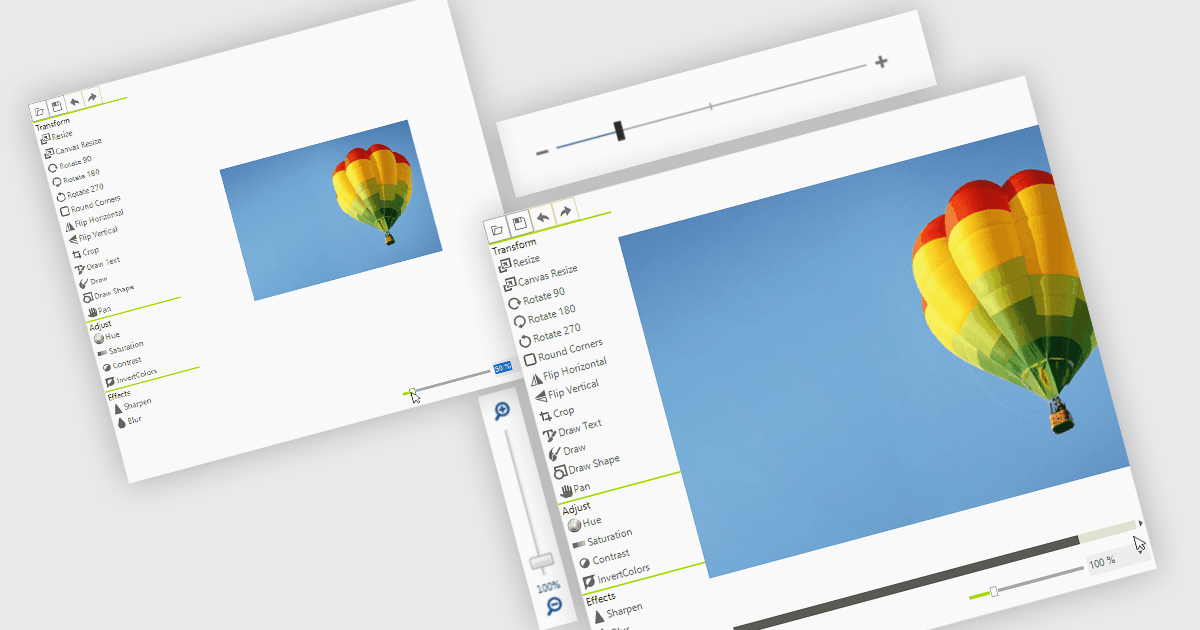
A zoom trackbar in a user interface (UI) is a visual control element that allows users to dynamically adjust the zoom level of content or a display area. They are typically represented as a slider, a linear bar with a draggable thumb, which can be oriented both horizontally or vertically. It provides real-time visual feedback and fine-grained control and is a quick and intuitive way to scale content such as images, documents, or data visualizations without relying on keyboard shortcuts or complex menus. This makes it a valuable feature in applications that handle large or complex visual data, where users need to alternate quickly between detailed inspection and broader overviews, such as graphic design tools, map interfaces, and analytical dashboards.
Several data editor collections for .NET provide zoom trackbars, including:
For an in-depth analysis of features and price, visit our comparison of .NET data editor collections.
전화 : 00798 14 800 6332
팩스 : +1 770 250 6199


