


공식 공급 업체
200 이상의 소프트웨어 개발처와 판매 계약을 맺은 공인 디스트리뷰터로서 합법적인 라이선스를 제공합니다.
모든 브랜드 보기.
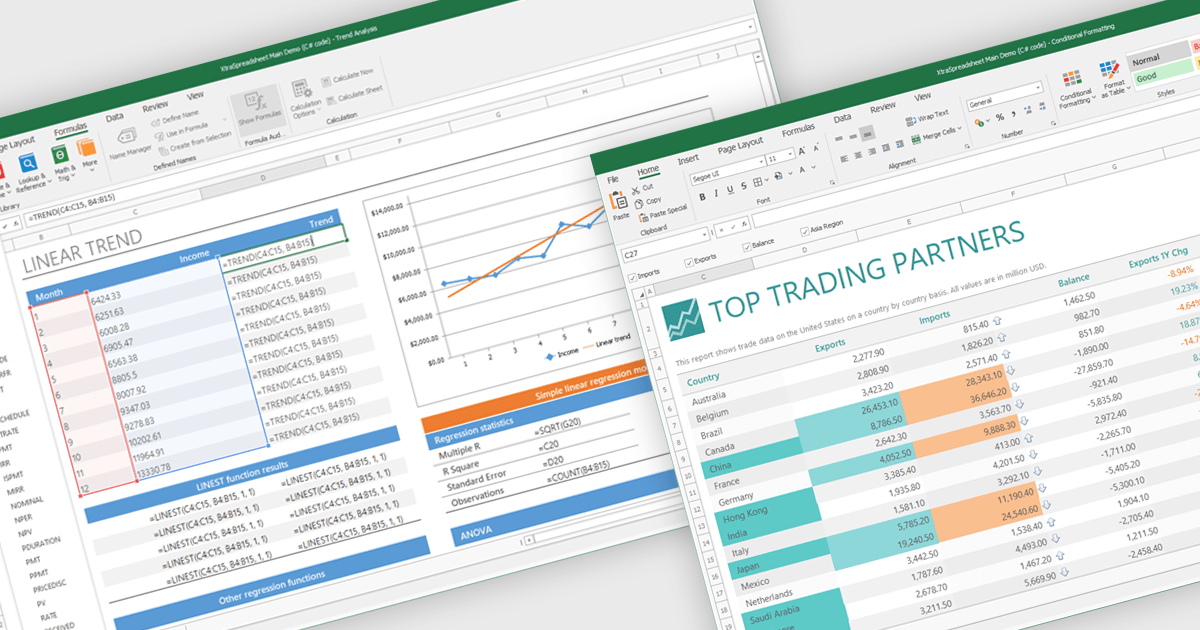
Chart support in a spreadsheet component refers to the ability to create, render, and manipulate various types of charts - such as line, bar, pie, and area charts - all within the spreadsheet environment. This functionality allows spreadsheet developers to present data visually and dynamically, without needing to rely on external charting libraries. The integration of charting capabilities enhances the end-user experience by making complex data more understandable. For developers, this reduces the need for separate visualization components, improves performance through tighter integration, and simplifies the deployment of data-centric applications.
Several .NET Winforms spreadsheet controls offer chart support, including:
For an in-depth analysis of features and price, visit our .NET Winforms spreadsheet controls comparison.
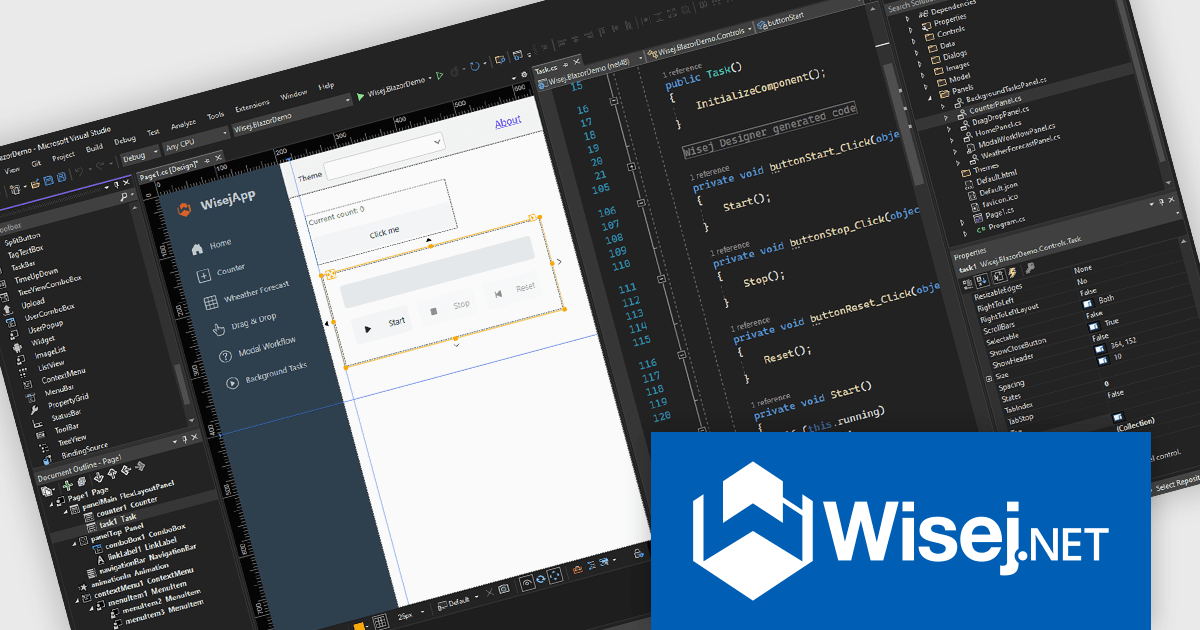
Wisej.NET is a cross-platform web framework enabling .NET developers to build modern HTML5 applications using C#/VB.NET instead of HTML and JavaScript. It provides a complete toolkit for mission-critical web applications, including UI components, session and state management, and backend integration. The integrated Visual Studio designer allows for pixel-perfect control across devices, making it an efficient solution for rapidly developing sophisticated web applications with a consistent look and feel for enterprise and line-of-business needs.
The Wisej.NET v4 update introduces a dedicated .NET Core-only designer, providing developers with the advantage of building applications exclusively with the latest .NET Core libraries. This eliminates the necessity of maintaining compatibility with the .NET Framework 4.8 designer, allowing projects to fully leverage the performance enhancements, modern APIs, and cross-platform capabilities inherent in .NET Core. By streamlining the development environment to focus solely on the .NET Core ecosystem, developers can create more efficient, robust, and future-proof web applications while utilizing the most up-to-date features of the .NET platform.
To see a full list of what's new in v4, see our release notes.
Wisej.NET is licensed per developer and per server. It is available as a perpetual license and includes a 1 year subscription that provides updates and support. See our Wisej.NET licensing page for full details.
For more information, see our Wisej.NET product page.
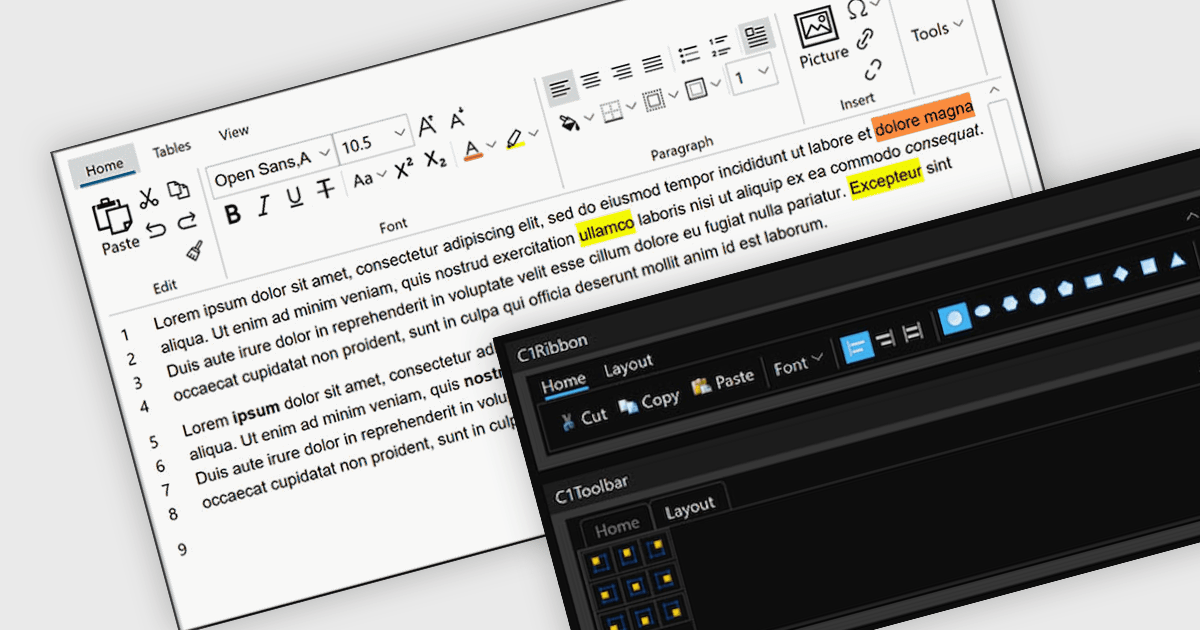
A toolbar user interface component is a horizontal or vertical strip that contains a set of buttons, icons, dropdowns or menus designed to provide quick access to commonly used functions within a software application. These customizable toolbars streamline user interactions by grouping related tools in a consistent and easily accessible location, often near the top or side of the interface. Toolbars enhance productivity by minimizing the number of steps required to perform frequent tasks, improving efficiency, and reducing the need to navigate through deeper menu hierarchies. Such a component also contributes to a cleaner and more organized interface, helping users perform actions more intuitively and with fewer interruptions.
Several WPF user interface suites provide you with toolbars, including:
For an in-depth analysis of features and price, visit our comparison of WPF user interface suites.
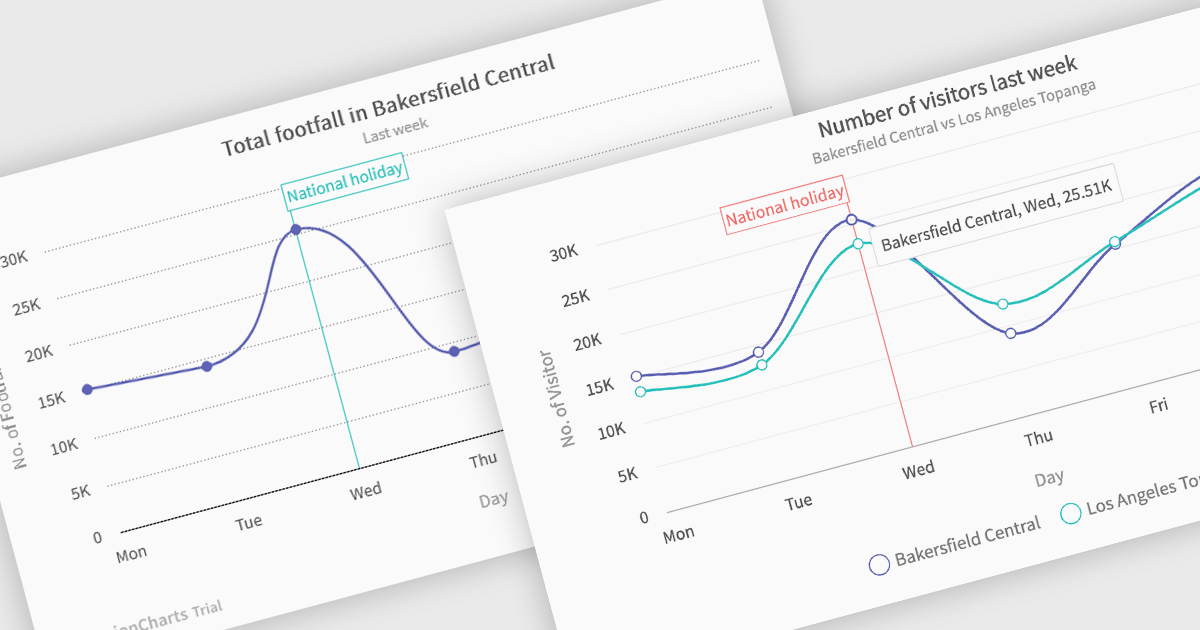
Spline charts are a type of line graph that displays continuous data points connected by smooth, curved lines, offering a visually fluid representation of trends and changes over time. This smoothing effect helps to highlight the overall trajectory of the data and can provide estimations of values between plotted points. Multi-Series Spline Charts extend this functionality by plotting multiple related datasets on the same graph, enabling direct visual comparison of their trends and the identification of correlations or divergences.
Several .NET Blazor chart controls offer spline charts including:
For an in-depth analysis of features and price, visit our .NET Blazor chart controls comparison.
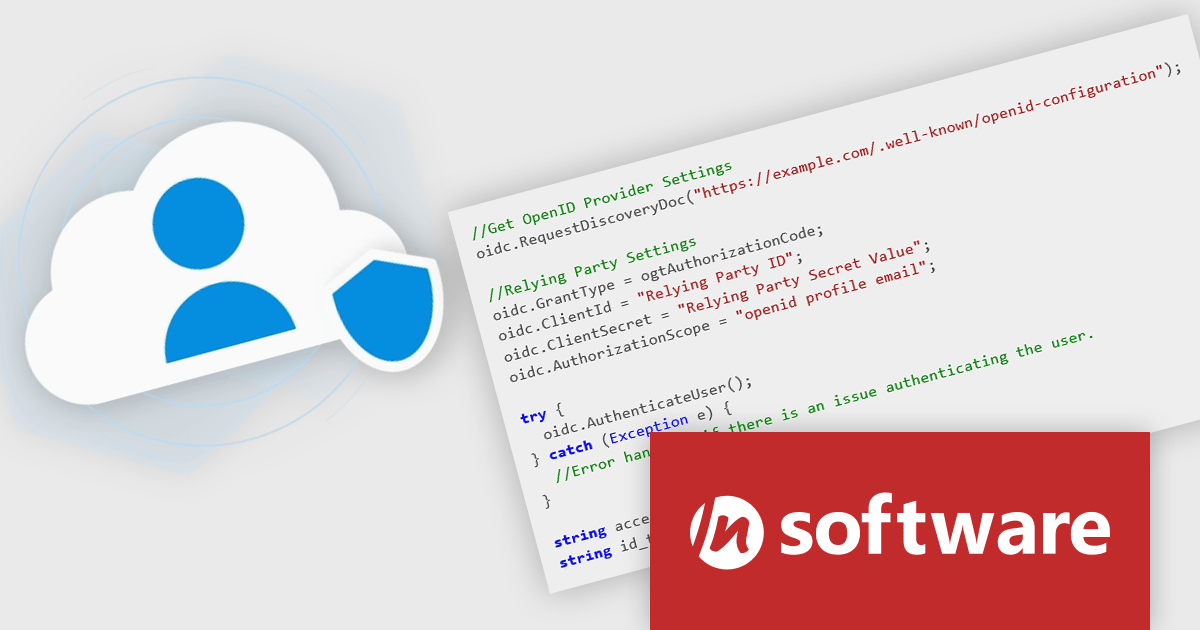
Cloud SSO, a new product in the Red Carpet Subscription Vol. 2 2025 update, dramatically simplifies the implementation of Single Sign-On (SSO) in modern applications. By supporting widely adopted standards like SAML (Security Assertion Markup Language) and OpenID Connect, this toolkit ensures seamless integration with virtually any major identity provider - including Microsoft, Google, Apple, GitHub, GitLab, Okta, and others. Developers can now enable centralized authentication without writing custom code for each provider, making it easier to build secure, scalable, and user-friendly login flows across cloud, mobile, and desktop applications.
To see a full list of what's new in Red Carpet Subscription Vol. 2 2025, see our release notes.
Red Carpet Subscription is licensed per developer and is available as a Perpetual License with a 12 month support and maintenance subscription. See our Red Carpet Subscription licensing page for full details.
For more information, visit our /n software Red Carpet Subscription product page.
전화 : 00798 14 800 6332
팩스 : +1 770 250 6199


