


공식 공급 업체
200 이상의 소프트웨어 개발처와 판매 계약을 맺은 공인 디스트리뷰터로서 합법적인 라이선스를 제공합니다.
모든 브랜드 보기.
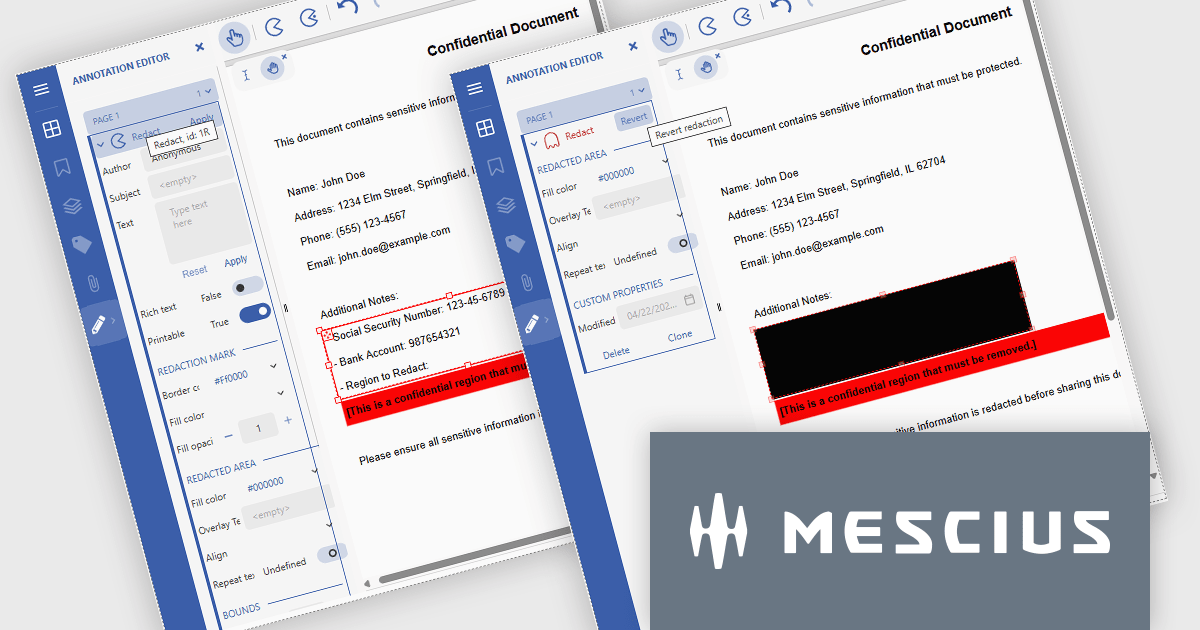
Document Solutions for PDF (DsPdf) by MESCIUS is a software development toolkit that provides .NET Core libraries and a JavaScript PDF viewer for manipulating and displaying PDFs. DsPdf enables developers to create, edit, annotate, and redact PDF documents directly within web applications. The included DsPdfViewer component offers a feature-rich, cross-platform solution for viewing and interacting with PDFs in modern browsers on various operating systems, including mobile devices.
The Document Solutions for PDF v8.1 update introduces robust redaction capabilities to the DsPdfViewer/Wasm, allowing users to add, edit, and apply redact annotations directly within the browser - without the need for a .NET server. This feature, available through the Professional DsPdfViewer license with WebAssembly (Wasm) SupportApi, ensures sensitive information can be securely removed or hidden with ease, enhancing compliance and document control in client-side PDF workflows.
To see a full list of what's new in version 8.1.0, see our release notes.
Document Solutions for PDF is licensed per developer and is available in several license options for differing distribution needs. Team licenses are also available for multiple developers within the same organization. See our Document Solutions for PDF licensing page for full details.
Document Solutions for PDF is available to buy individually or as part of Document Solutions .NET Bundle.
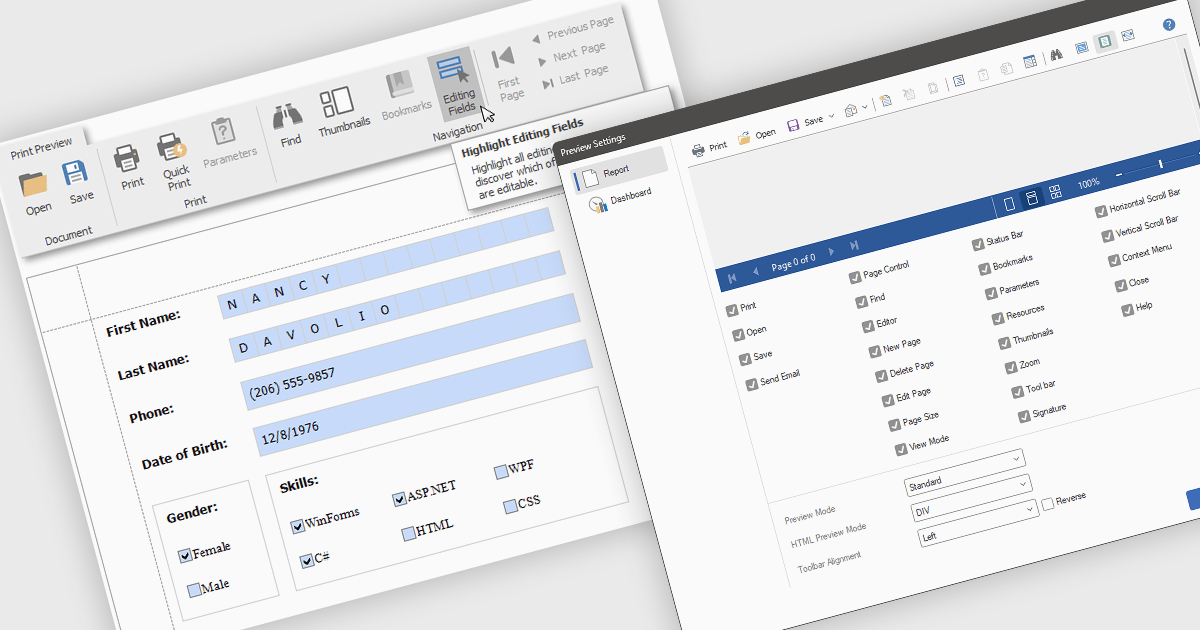
Editing reports in preview mode enables direct modification of report elements like text, charts, and layout within the review window. This approach offers benefits such as faster iteration, improved accuracy, and enhanced efficiency by eliminating the need to switch between edit and preview modes. Teams can adjust chart labels for clarity or tweak a report's layout for better presentation, instantly seeing the impact of their changes and improving the report finalization process.
Several .NET WPF Reporting Controls offer support for editing in preview including:
For an in-depth analysis of features and price, visit our comparison of .NET WPF Reporting Controls.
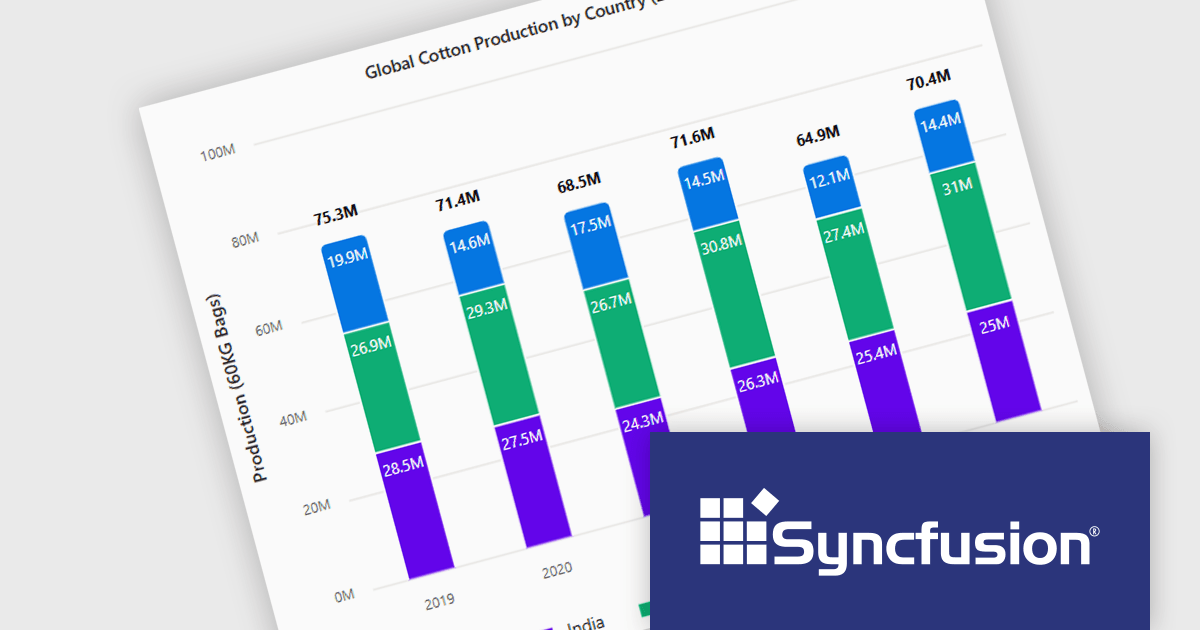
Syncfusion Essential Studio ASP.NET MVC (available as part of Syncfusion Essential Studio Enterprise) is a comprehensive suite of web UI controls that empowers developers to craft rich, interactive ASP.NET MVC applications. Backed by the lightweight and modular Essential JS 2 library, it offers over 80 components ranging from data grids and charts to schedulers and pivot grids, while ensuring a seamless integration with the MVC framework for an efficient development experience.
The Syncfusion Essential Studio ASP.NET MVC 2025 Volume 1 release introduces the ability to display cumulative totals directly within data labels on stacked charts. This enhancement provides immediate insight into the overall contributions of each category or series without requiring interaction or external calculations. By making the total visible at a glance, it improves data readability, supports faster decision making, and enhances dashboard usability, particularly in performance monitoring, financial reporting, and sales analysis applications.
To see a full list of what's new in 2025 Volume 1, see our release notes.
Syncfusion Essential Studio ASP.NET MVC is available as part of Syncfusion Essential Studio Enterprise which is licensed per developer starting with a Team License of up to five developers. It is available as a 12 Month Timed Subscription License which includes support and maintenance. See our Syncfusion Essential Studio Enterprise licensing page for full details.
Learn more on our Syncfusion Essential Studio ASP.NET MVC product page.

Telerik UI for .NET MAUI is a robust suite of user interface components designed to simplify the creation of cross-platform applications using .NET Multi-platform App UI (MAUI). It offers a wide range of pre-built controls, including charts, grids, and navigation elements, enabling developers to build visually appealing, high-performance apps for Android, iOS, Windows, and macOS from a shared codebase. By ensuring a consistent user experience across platforms, it accelerates development and allows a focus on functionality, making it ideal for business applications, dashboards, and data-driven projects.
Telerik UI for .NET MAUI includes integration between the DataPager and RadCollectionView, enabling developers to efficiently implement paging for large data sets with minimal performance impact. This enhancement simplifies the process of managing and displaying paginated data, allowing for smoother scrolling and a more responsive user interface. Developers can take advantage of built-in support for navigation controls, page size configuration, and customizable templates, making it easier to build scalable and intuitive data presentation experiences within .NET MAUI applications.
Telerik UI for .NET MAUI is licensed per developer and has two licensing models: an annual Subscription License and a Perpetual License. The Subscription license provides access to the latest product updates, technical support, and exclusive benefits for a flat annual fee, and must be renewed to continue using the software. The Perpetual license is a one-time purchase granting access to the current released version and includes a one-year subscription for product updates and technical support. After this initial period, users can choose to renew the subscription element to continue receiving updates and support; otherwise, they may continue using the installed version available during their active subscription term but will forgo future updates and support. See our Telerik UI for .NET MAUI licensing page for full details.
Telerik UI for .NET MAUI is available individually or as part of the following products:
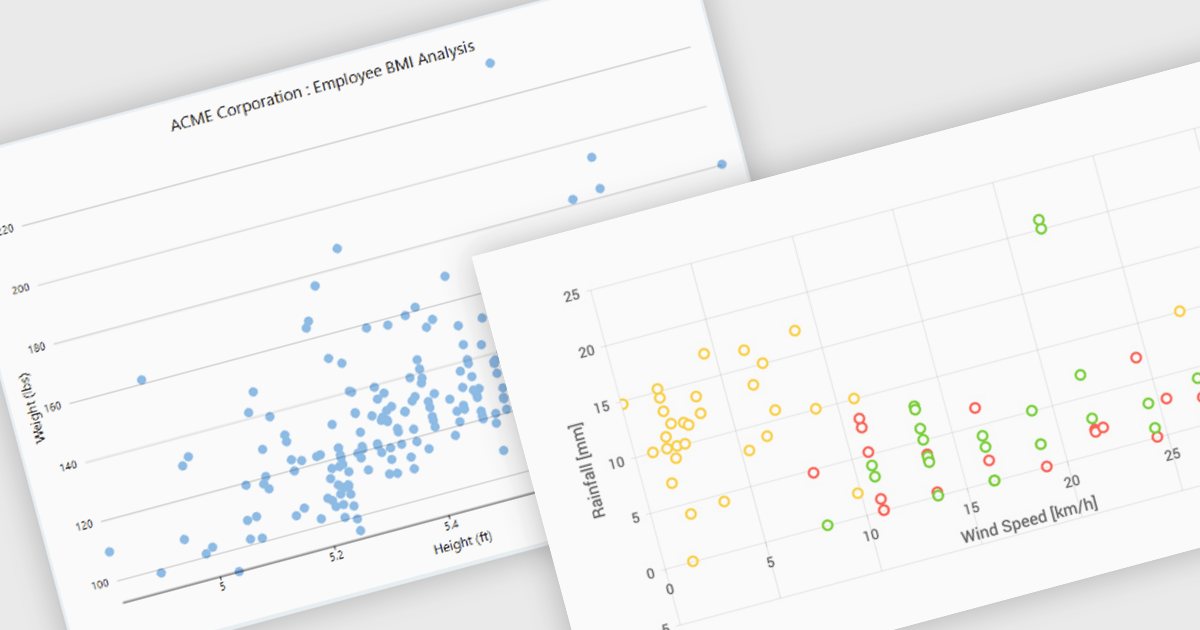
Scatter charts, also known as scatter plots or scatter diagrams, are fundamental visualization tools used to explore the relationship between two continuous variables by plotting data points, where each point's position is determined by its corresponding values for the two variables. This visual representation effectively reveals correlations and helps identify outliers, clusters, and the overall range and distribution of the data. The benefits of using scatter charts include their simplicity in conveying complex relationships, their ability to highlight anomalies that might be missed in tabular data, and their role as a precursor to more advanced statistical analyses like regression.
Several .NET WinForms chart controls offer scatter charts including:
For an in-depth analysis of features and price, visit our .NET WinForms chart controls comparison.
전화 : 00798 14 800 6332
팩스 : +1 770 250 6199


