


공식 공급 업체
200 이상의 소프트웨어 개발처와 판매 계약을 맺은 공인 디스트리뷰터로서 합법적인 라이선스를 제공합니다.
모든 브랜드 보기.

Being able to export to HTML is a valuable feature of a reporting application. Exporting reports to HTML files involves converting data visualizations and analytical summaries from a native format into web-friendly HTML pages. This allows for wider accessibility, sharing, and potentially embedding reports within websites. Static reports are transformed into interactive documents easily viewable on any device with a web browser. This format is ideal for sharing reports with collaborators, posting them online, or simply ensuring they remain accessible even if the original software becomes unavailable.
These Vue.js report components allow you to export reports to HTML files:
For an in-depth analysis of features and price, visit our comparison of Vue.js Reporting components.
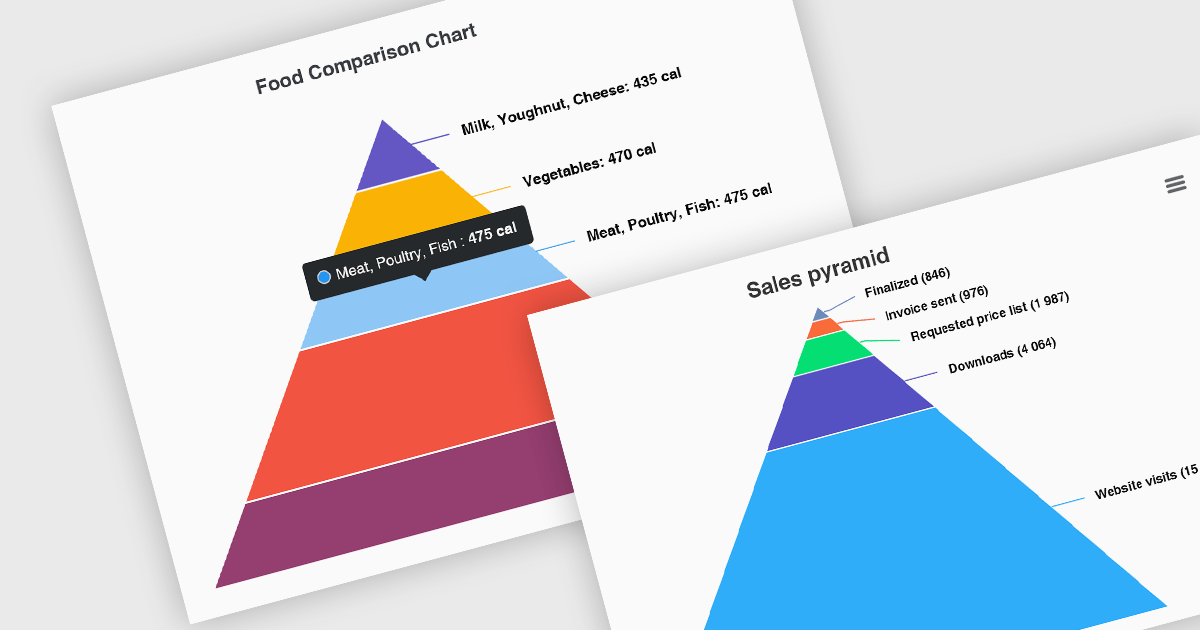
Pyramid charts, also known as triangle diagrams, utilize a triangular shape segmented into horizontal sections, each representing a level in a hierarchy, process, or simple dataset. Their strength lies in visually depicting hierarchical relationships, emphasizing the relative importance or size of each level through varying widths. The easily understood layout makes them ideal for communicating clear, singular data points in fields like sales funnels, population structures, and educational concepts.
Several Vue.js chart controls offer pyramid charts including:
For an in-depth analysis of features and price, visit our Vue.js chart controls comparison.

LightningChart JS is a high-performance JavaScript charting library that utilizes WebGL rendering and GPU acceleration to deliver exceptional performance for a wide range of data visualization needs. It is designed to handle large datasets and complex visualizations with ease, enabling developers to create interactive and visually appealing charts for various applications.
The LightningChart JS v5.1.0 release lets you unleash the power of complex visualizations with the new Mesh Model 3D chart type. Render intricate geometries and models with dynamic coloring pulled from a separate data set in real-time. The PaletteFill feature imbues 3D Mesh Models with vibrant colors based on vertex values, transforming your charts into captivating representations of even the most detailed 3D shapes.
To see a full list of what's new in v5.1.0, see our release notes.
LightningChart JS is licensed based on method of deployment with options including SaaS Developer Licenses, Application Developer Licenses, and Publisher Developer Licenses. Each license is perpetual and includes 1 year subscription for technical support and software updates. See our LightningChart JS licensing page for full details.
Learn more on our LightningChart JS product page.

ONLYOFFICE Docs is a comprehensive online editor, allowing users to create text documents, spreadsheets, presentations, and forms. It enables your users to edit, share, and collaborate on documents online in their preferred browser, within your own application. It's fully compatible with OOXML (Office Open XML) formats and supports popular Microsoft Office and other document formats such as CSV, DOC, DOCX, EPUB, HTML, ODP, ODS, ODT, PDF, PPT, PPTX, RTF, TXT, XLS, and XLSX.
The ONLYOFFICE Docs v8.0 update gives developers the ability to create complex, flexible forms with diverse field types and rich formatting options directly in familiar DOCXF templates. Collaborate seamlessly with colleagues and easily fill out forms from other applications, all within desktop and mobile apps. This major update caters to user feedback, promoting cross-platform compatibility and streamlined form integration for developers. Existing OFORM forms automatically convert to PDF upon opening in version 8.0.
To see a full list of what's new in v8.0.0, see our release notes.
ONLYOFFICE Docs is licensed by the number of simultaneous document connections and is available as an annual license with 1 year support and upgrades. See our ONLYOFFICE Docs licensing page for full details.
For more information, see our ONLYOFFICE Docs product page.

Smart HTML Elements is an enterprise-grade UI library offering pre-built web components for developers in Angular, React, Vue, Blazor, and JavaScript. It boasts over 60 ready-to-use components like grids, charts, schedulers, and editors, all featuring two-way data binding, responsiveness, accessibility, and theming capabilities. This library helps developers rapidly build dynamic and modern web applications with consistent look-and-feel and rich functionalities, accelerating development time and ensuring professional quality.
The Smart HTML Elements v18.0.0 release adds a new grid card view layout that leverages CSS grid to offer an adaptive container for presenting information in a visually appealing card format. Cards can be dynamically populated with text, images, and other multimedia elements, allowing for customization and adaptation to diverse content types. The responsive layout automatically adjusts to various screen sizes and device orientations, ensuring optimal card arrangement and user experience across platforms.
To see a full list of what's new in v18.0.0, see our release notes.
Smart HTML Elements is licensed per developer and is available as a Perpetual license with 1 year support and maintenance. It includes distribution to Unlimited Web applications, SaaS projects, Intranets and Websites. See our Smart HTML Elements licensing page for full details.
Learn more on our Smart HTML Elements product page.
전화 : 00798 14 800 6332
팩스 : +1 770 250 6199


