


공식 공급 업체
200 이상의 소프트웨어 개발처와 판매 계약을 맺은 공인 디스트리뷰터로서 합법적인 라이선스를 제공합니다.
모든 브랜드 보기.
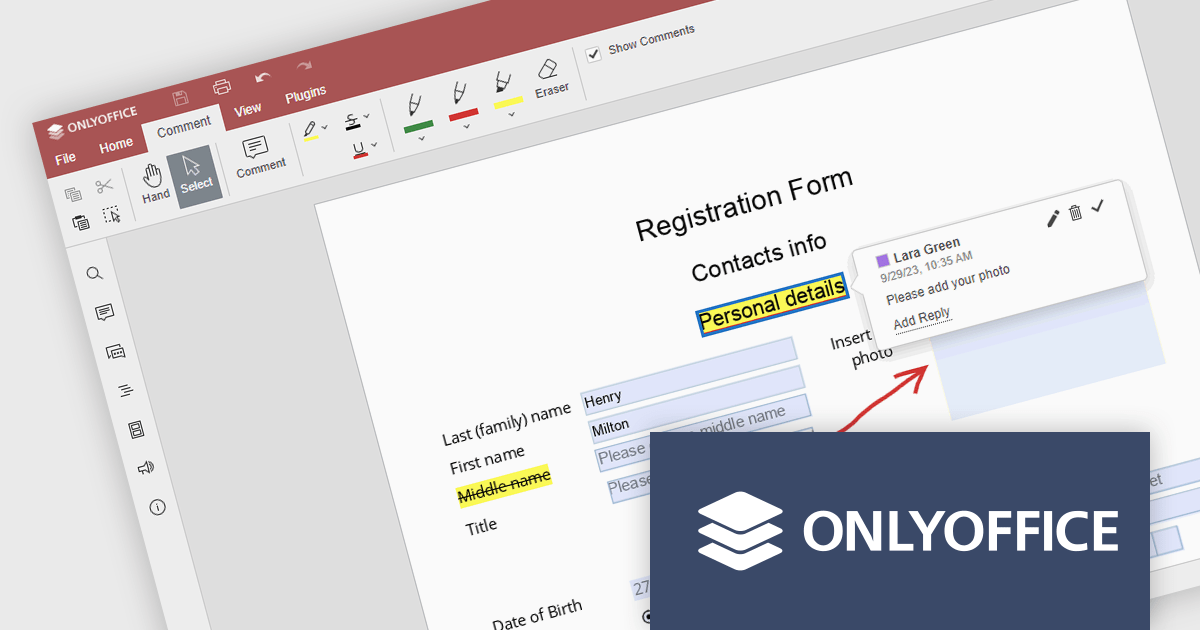
ONLYOFFICE Docs Enterprise Edition with WordPress Connector combines an online document editor with a seamless integration for WordPress, which is a content management system for creating and managing websites. This allows teams to create, view, edit, and collaborate on spreadsheets, presentations, and text files online, directly within WordPress, boosting efficiency and eliminating the need for file switching.
The ONLYOFFICE WordPress Connector 2.0.0 release (available as part of ONLYOFFICE Docs Enterprise Edition with WordPress Connector v8.0.1) brings the ability to open PDF files uploaded to your WordPress site directly within the admin dashboard for form filling and annotating using ONLYOFFICE Docs. You can fill out interactive fields, highlight, underline and strikethrough text, leave comments, and draw different objects and lines with the built-in drawing tools. By enabling seamless interactions with PDF documents directly within the platform and reducing the steps needed to edit or comment on PDF files, this capability streamlines document management workflows, optimizes productivity and eliminates the need for external software solutions.
To see a full list of what's new in ONLYOFFICE Docs Enterprise Edition v8.0.1 with WordPress Connector 2.0.0, see our release notes.
ONLYOFFICE Docs Enterprise Edition with WordPress Connector is licensed per server and is available as an annual license with 1 year of support and updates, or as a perpetual license with 3 years of support and updates. See our ONLYOFFICE WordPress connector licensing page for full details.
For more information, see our ONLYOFFICE WordPress connector product page.

Charting support within a reporting component refers to the functionality that enables data visualization through charts and graphs. This integration offers several advantages for developers. By leveraging built-in charting capabilities, developers can streamline the reporting process, reducing the need for manual chart creation and improving report clarity and interactivity for end users. This not only saves development time but also fosters a more intuitive user experience for data exploration and analysis.
Several Vue.js reporting components support charts including:
For an in-depth analysis of features and price, visit our Vue.js Reporting Components comparison.
Syncfusion Essential Studio JavaScript, available as part of Syncfusion Essential Studio Enterprise, is a comprehensive UI library offering over 80 high-performance, lightweight, and responsive components to transform your web apps. Built from scratch with TypeScript, it boasts modularity and touch-friendliness, letting you pick and choose specific features while ensuring smooth mobile interaction. With rich themes, global accessibility features, and extensive documentation, it powers everything from basic buttons to interactive charts and data grids, simplifying front-end development across JavaScript, Angular, React, and Vue.
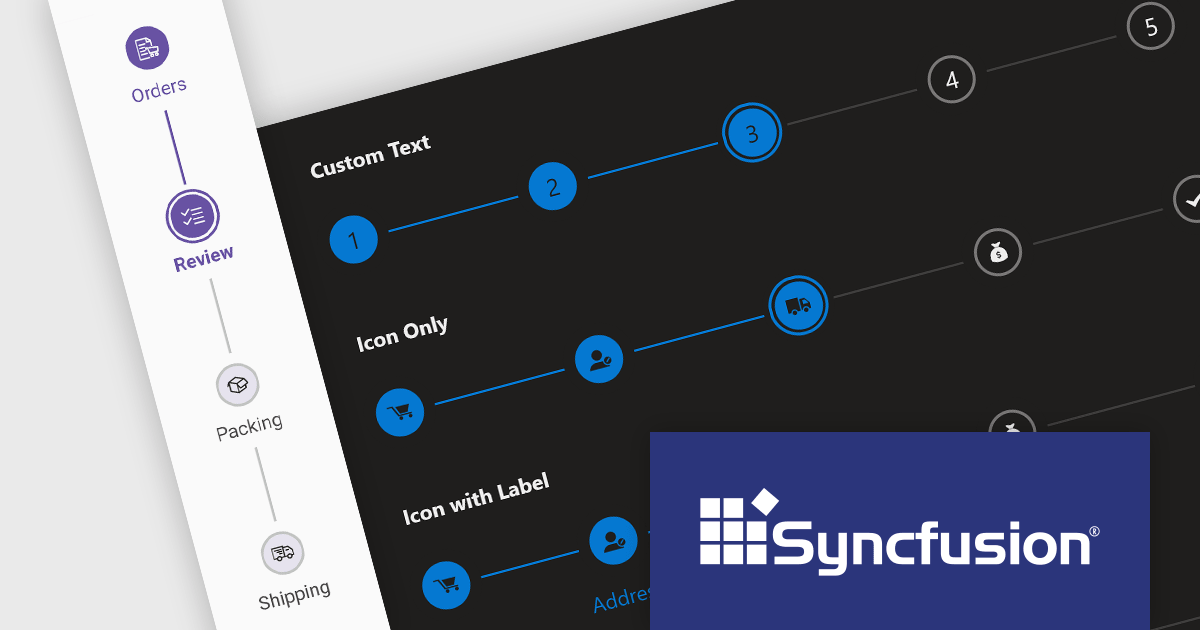
The Syncfusion Essential Studio JavaScript 2024 Volume 1 (25.1.35) release introduces the production-ready Stepper component which simplifies the creation of wizards and walkthroughs within your web applications. It provides a user-friendly interface to guide users through a step-by-step process, enhancing the overall user experience. The component offers a variety of step types, orientations, and customization options to perfectly suit your specific requirements.
To see a full list of what's new in version 2024 Volume 1 (25.1.35), see our release notes.
Syncfusion Essential Studio JavaScript is available as part of Syncfusion Essential Studio Enterprise which is licensed per developer starting with a Team License of up to five developers. It is available as a 12 Month Timed Subscription License which includes support and maintenance. See our Syncfusion Essential Studio Enterprise licensing page for full details.
For more information, visit our Syncfusion Essential Studio JavaScript product page.
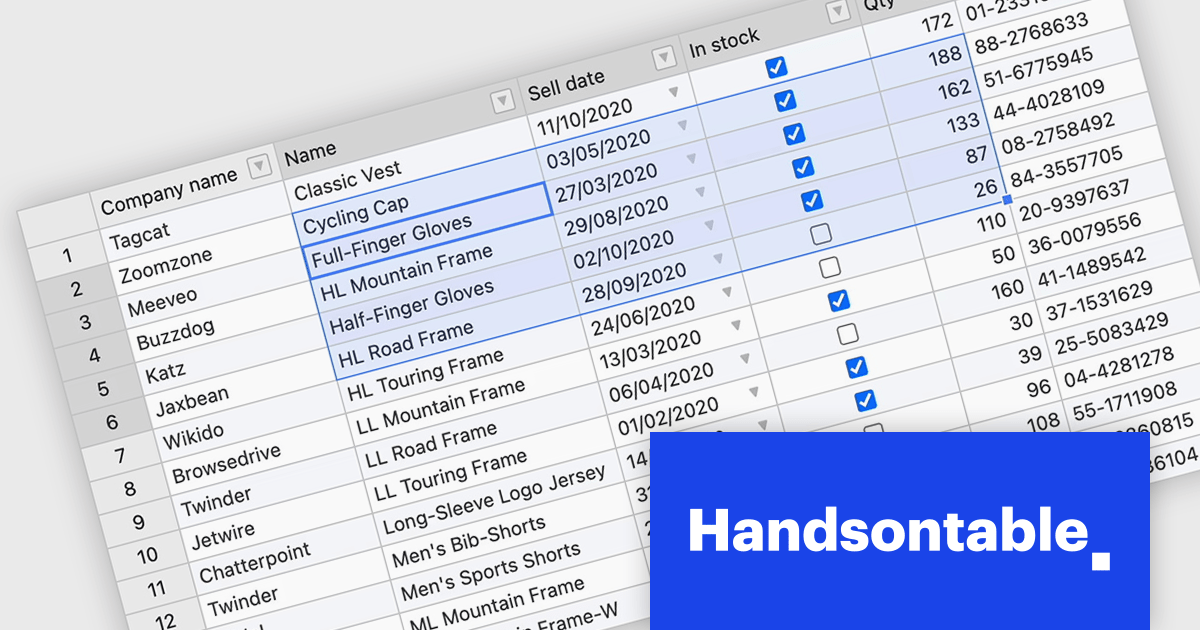
Handsontable is a JavaScript library designed to help developers build interactive data grids into their web applications. Offering a familiar spreadsheet-like interface, it allows users to edit, sort, and filter data with ease. Highly customizable and compatible with popular frameworks like React and Angular, Handsontable empowers developers to build robust data manipulation features into their web applications.
Handsontable 14.3 adds a new feature to streamline navigation within pre-selected cells. Power users and those accustomed to Tab navigation can now leverage arrow keys or the mouse for selection, then efficiently move between the chosen cells using Tab/Shift+Tab for horizontal movement and Enter/Shift+Enter for vertical movement. Editing remains intuitive, as typing any character initiates editing even within dropdown or date cells.
To see a full list of what's new in version 14.3.0, see our release notes.
Handsontable is licensed per developer and is available as an Annual or Perpetual license with 1 year support and maintenance. See our Handsontable licensing page for full details.
For more information, visit our Handsontable product page.
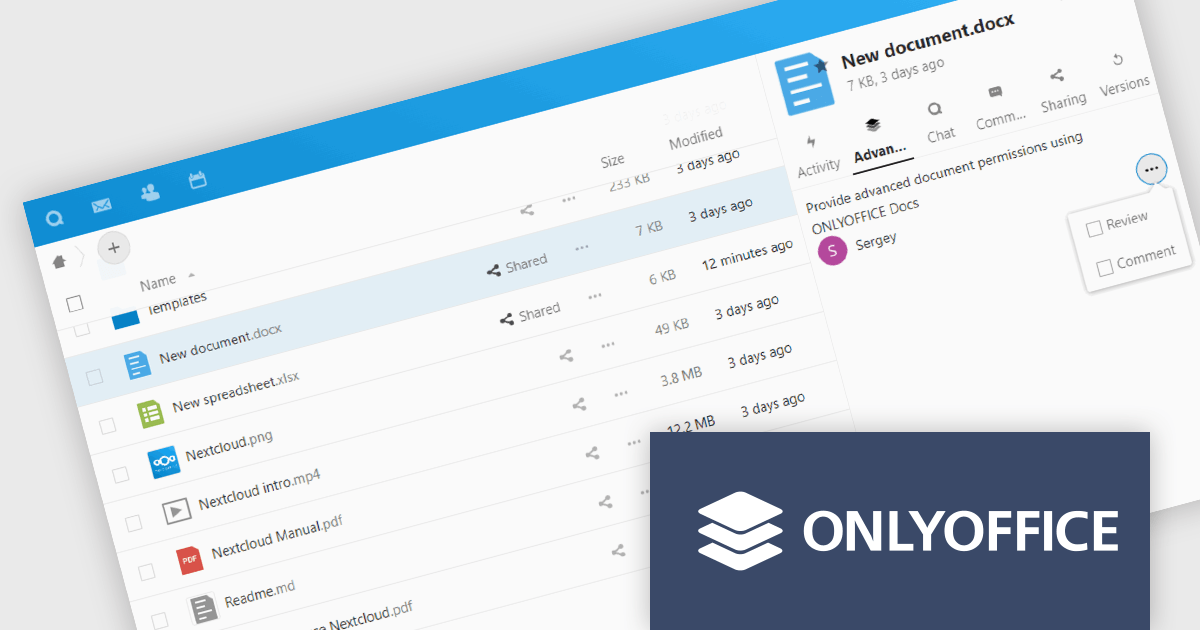
ONLYOFFICE Docs Enterprise Edition with Nextcloud Connector combines an online document editor with a seamless integration for Nextcloud, which is a open-source, on-premises content collaboration platform. This allows teams to create, view, edit, and collaborate on spreadsheets, presentations, and text files online, directly within Nextcloud, boosting efficiency and eliminating the need for file switching.
The ONLYOFFICE Nextcloud Connector v9.1 release (available as part of ONLYOFFICE Docs Enterprise Edition with Nextcloud Connector v8.0.1) brings enhanced security and granular control for developers working with public document sharing and Nextcloud Talk. Advanced access permissions for reviewing, commenting and custom filtering are now available for files with public access and for files created within the Nextcloud Talk app. These permissions ensure that external collaborators can contribute without compromising document integrity or security. It also promotes a more structured and controlled environment for real-time collaboration, ensuring that contributions are tracked and managed effectively according to the roles defined by the document owner.
To see a full list of what's new in ONLYOFFICE Docs Enterprise Edition v8.0.1 with Nextcloud Connector v9.1, see our release notes.
ONLYOFFICE Docs Enterprise Edition with Nextcloud Connector is licensed per server and is available as an annual license with 1 year of support and updates, or as a perpetual license with 3 years of support and updates. See our ONLYOFFICE Nextcloud connector licensing page for full details.
For more information, see our ONLYOFFICE Nextcloud connector product page.
전화 : 00798 14 800 6332
팩스 : +1 770 250 6199


