


공식 공급 업체
200 이상의 소프트웨어 개발처와 판매 계약을 맺은 공인 디스트리뷰터로서 합법적인 라이선스를 제공합니다.
모든 브랜드 보기.
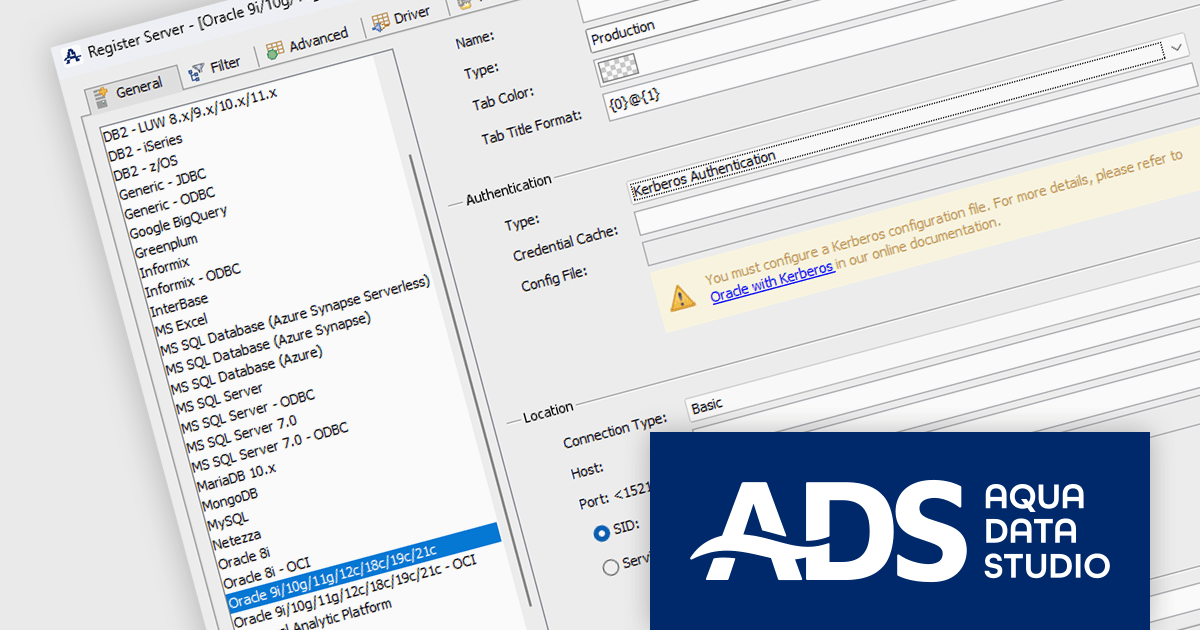
Aqua Data Studio by AquaFold is a versatile database integrated development environment (IDE) designed for database administration, development, and management. Supporting a wide range of relational, NoSQL, and cloud databases, Aqua Data Studio provides an intuitive interface for writing and executing SQL queries, visualizing data, and managing database structures efficiently. With robust features such as schema comparison, ER (Entity-Relationship) diagram generation, and integrated version control, it enables developers, analysts, and database administrators to streamline workflows and improve productivity across multiple database platforms.
The Aqua Data Studio v25.5 update introduces Kerberos support for Oracle, allowing developers to authenticate to Oracle databases using enterprise-managed Kerberos credentials instead of traditional username and password methods. This enhancement aligns Aqua Data Studio with environments that already use Kerberos-based authentication, ensuring compatibility with centralized identity management practices. Once configured it provides a standards-based authentication option that integrates securely with existing corporate infrastructure.
To see a full list of what's new in v25.5, see our release notes.
Aqua Data Studio is licensed per user on an annual subscription basis, which includes usage rights, support, and software updates. To continue to use the software, users must renew their subscription each year. See our Aqua Data Studio licensing page for full details.
For more information, visit our Aqua Data Studio product page.
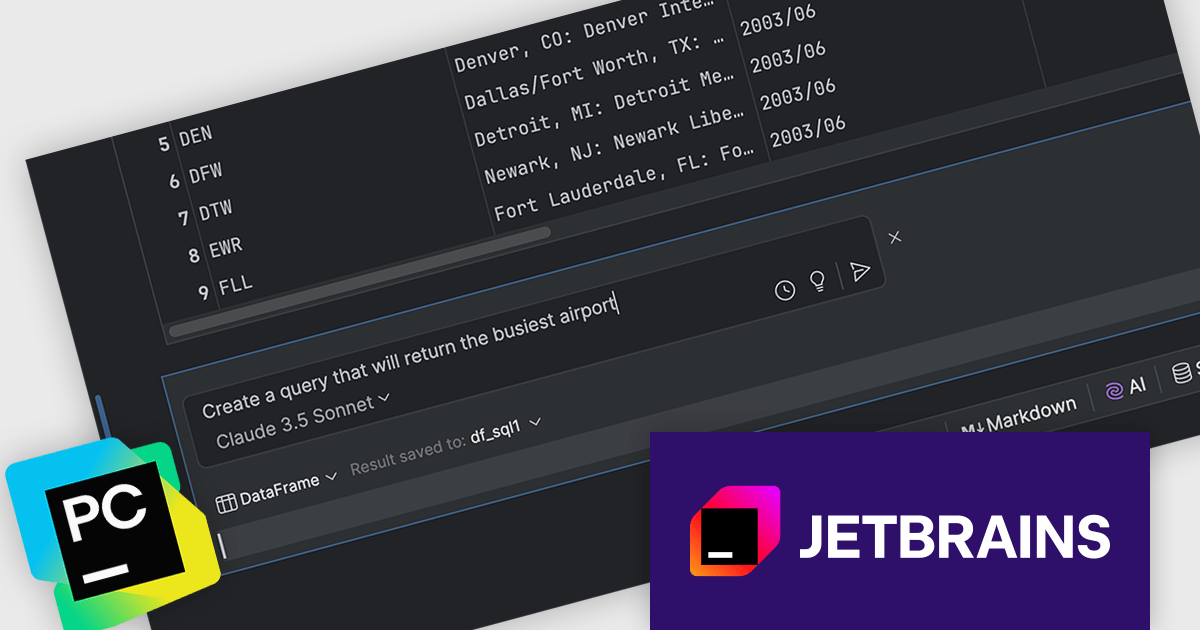
PyCharm by JetBrains is a comprehensive Integrated Development Environment (IDE) specifically designed for Python programming. It offers a range of features to enhance productivity, including code analysis for error detection, a visual debugger for troubleshooting, integrated unit testing for code verification, and support for version control systems to manage code changes. PyCharm also caters to web development using frameworks like Django, making it a powerful tool for both experienced developers and beginners in the Python world.
The PyCharm 2025.2 release has expanded the capabilities of its AI Assistant to include context-aware code generation for both Jupyter notebooks and SQL cells. This enhancement allows the assistant to analyze the content of the source cell and provide more precise and contextually relevant code suggestions. For developers working with notebooks, this means the AI can now better understand the flow and logic of your data science or machine learning projects, offering tailored Python snippets that align with the existing code. Similarly, when working in SQL cells, the assistant takes into account the previous queries or table structures to generate more accurate SQL commands.
To see a full list of what's new in version 2025.2, see our release notes.
PyCharm is licensed per user, and is available as a commercial annual subscription license. We can supply new subscriptions, subscription renewals, lapsed renewals, and additional user licenses. See our PyCharm licensing page for full details.
PyCharm is available to buy in the following products:
JetBrains subscription prices will increase for their IDEs, .NET Tools, dotUltimate, and the JetBrains All Products Pack, effective October 1st, 2025. The new pricing for each product is shown below:
| Product | Current SRP | New SRP |
|---|---|---|
| All Products Pack | $779/€779 | $979/€979 |
| IntelliJ IDEA | $599/€599 | $719/€719 |
| PyCharm | $249/€249 | $299/€299 |
| PhpStorm | $249/€249 | $289/€289 |
| GoLand | $249/€249 | $289/€289 |
| DataGrip | $229/€229 | $259/€259 |
| CLion | $229/€229 | $259/€259 |
| DataSpell | $229/€229 | $299/€299 |
| RubyMine | $229/€229 | $269/€269 |
| WebStorm | $159/€159 | $199/€199 |
| ReSharper | $349/€349 | $389/€389 |
| Rider | $419/€419 | $519/€519 |
| dotUltimate | $469/€469 | $609/€609 |
SRP = Suggested Retail Price as at August 1st, 2025.
Special Offer: Renew early at the current price and save money! You can renew at the current price for up to two years in advance.
For new and existing customers, JetBrains is temporarily changing the maximum allowable renewal period. Both new and existing customers can prepay for their subscriptions from July 31st, 2025 to September 30th, 2025 to secure the current price, with commercial customers able to take out up to a 2-year subscription.
Act Now: To get your new or renewal licenses at the current price, before the price increase!
NEWS UPDATED - Please Note: If you renew early, before the end of September, your current expiration date will not change. For example, if your current subscription ends on December 10th, 2025 and you renew now for 1-year, your new expiration date will be December 10th, 2026 or if you renew now for 2-years, your new expiry date will be December 10th, 2027.
Click your product in the table above and use the 'Get Quote' form to receive your renewal price, or contact us to discuss new or renewal subscription licensing.
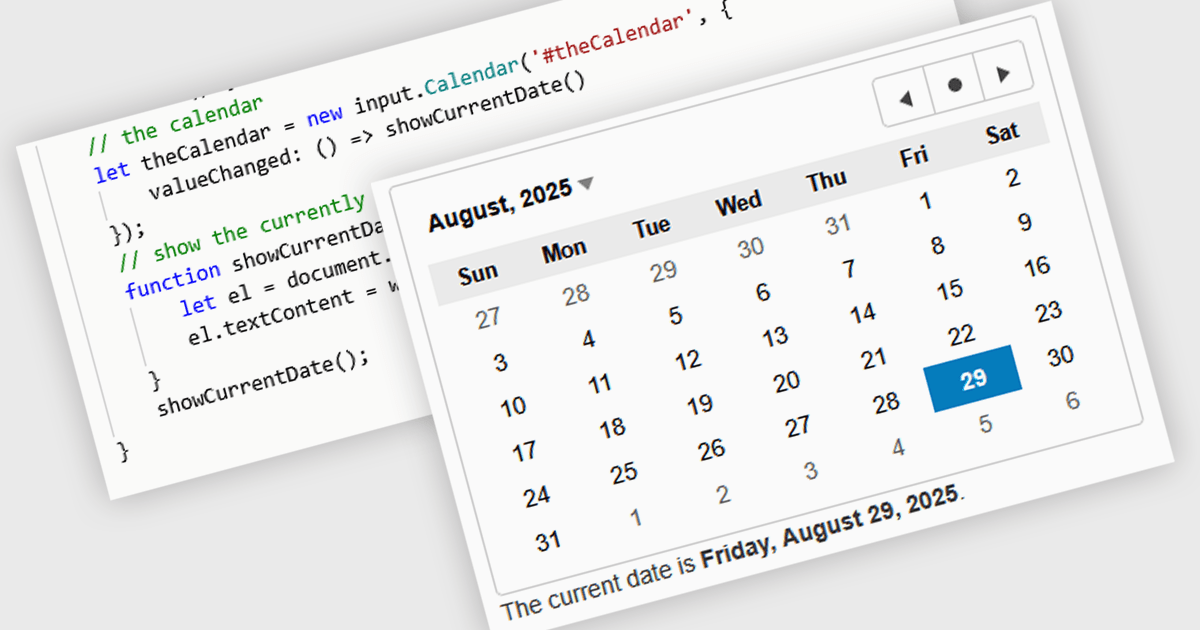
JavaScript calendar controls are user interface components that allow users to select and edit date values directly within data editing environments, such as forms or grids. These controls typically integrate a visual calendar picker, enabling consistent and accurate date input while reducing manual entry errors. For developers, they simplify validation, support localization, and integrate with various data sources, helping ensure a more efficient and user-friendly experience in web applications that require date-related input or filtering.
Several JavaScript data editor collections offer calendar controls including:
For an in-depth analysis of features and price, visit our comparison of JavaScript Data Editors.
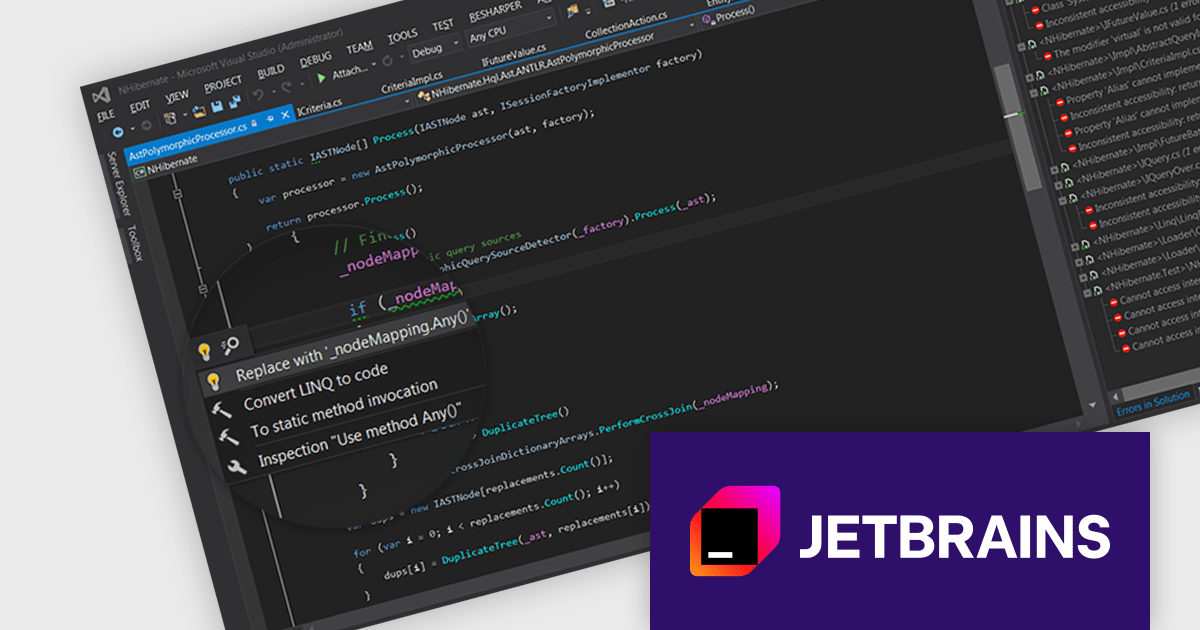
PhpStorm by JetBrains is a sophisticated Integrated Development Environment (IDE) specifically designed for PHP and web development. It offers a range of features to enhance your coding experience, including syntax highlighting, intelligent code completion, on-the-fly error detection, built-in debugging tools, and advanced code refactoring capabilities. It also supports various web technologies like HTML, CSS, and JavaScript, making it a versatile tool for building complete web applications.
The PhpStorm version 2025.2 release introduces comprehensive remote development support, allowing developers to work with projects hosted on remote machines, in development containers, or via Windows Subsystem for Linux (WSL). This feature enables users to check out, load, and fully interact with projects - including indexing, analyzing, building, running, debugging, and testing - without requiring the codebase to reside locally. Remote development is particularly useful for those looking to develop on a different operating system than the one installed locally, or for teams that rely on high-performance hardware located in data centers or the cloud. It also supports using PhpStorm as a thin client, where only the IDE interface runs locally, while all computational tasks are handled remotely.
To see a full list of what's new in version 2025.2, see our release notes.
PhpStorm is licensed per user, and is available as a commercial annual subscription license. We can supply new subscriptions, subscription renewals, lapsed renewals, and additional user licenses. See our PhpStorm licensing page for full details.
PhpStorm is available to buy in the following products:
전화 : 00798 14 800 6332
팩스 : +1 770 250 6199


