


공식 공급 업체
200 이상의 소프트웨어 개발처와 판매 계약을 맺은 공인 디스트리뷰터로서 합법적인 라이선스를 제공합니다.
모든 브랜드 보기.
Oxygen Publishing Engine is a high-performance solution designed for automating the generation of various types of technical documentation. Built on the robust Oxygen XML Author and Oxygen XML Editor platforms, it provides advanced support for transforming structured content, such as DITA (Darwin Information Typing Architecture), DocBook, and HTML, into multiple output formats, including PDF, HTML, and EPUB. The engine is optimized for integration into continuous integration and continuous deployment (CI/CD) workflows, allowing organizations to streamline their documentation processes while maintaining consistency and compliance with industry standards.
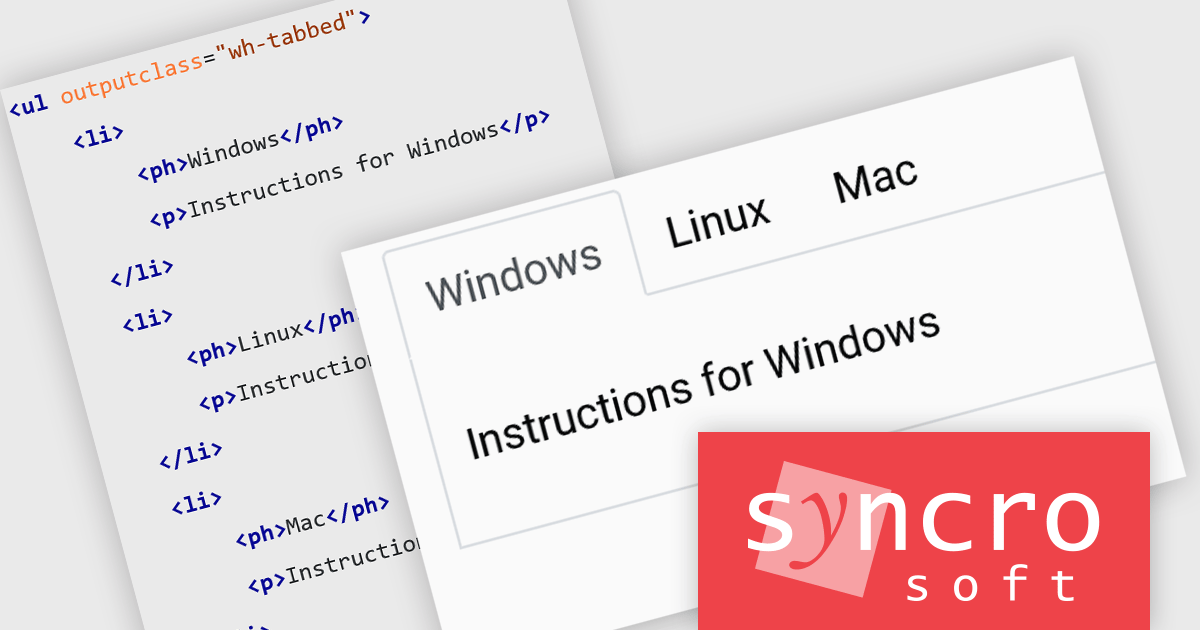
The Oxygen Publishing Engine 27.0 release enhances the readability and organization of structured content by allowing specific elements to be presented as tabs in the output. By using the outputclass="wh-tabbed" attribute, lists, definition lists, and choice tables can be transformed into interactive tabbed sections, improving navigation and user experience, especially in complex documentation.
To see a full list of what's new in 27.0, see our release notes.
The Oxygen Publishing Engine is available in both Professional and Enterprise editions and is offered as a Perpetual License, priced per core, starting with a minimum of two cores. Each license includes a one-year Support & Maintenance Pack (SMP), which provides unlimited technical support along with access to all major and minor updates. See our Oxygen Publishing Engine licensing page for full details.
Learn more on our Oxygen Publishing Engine product page.
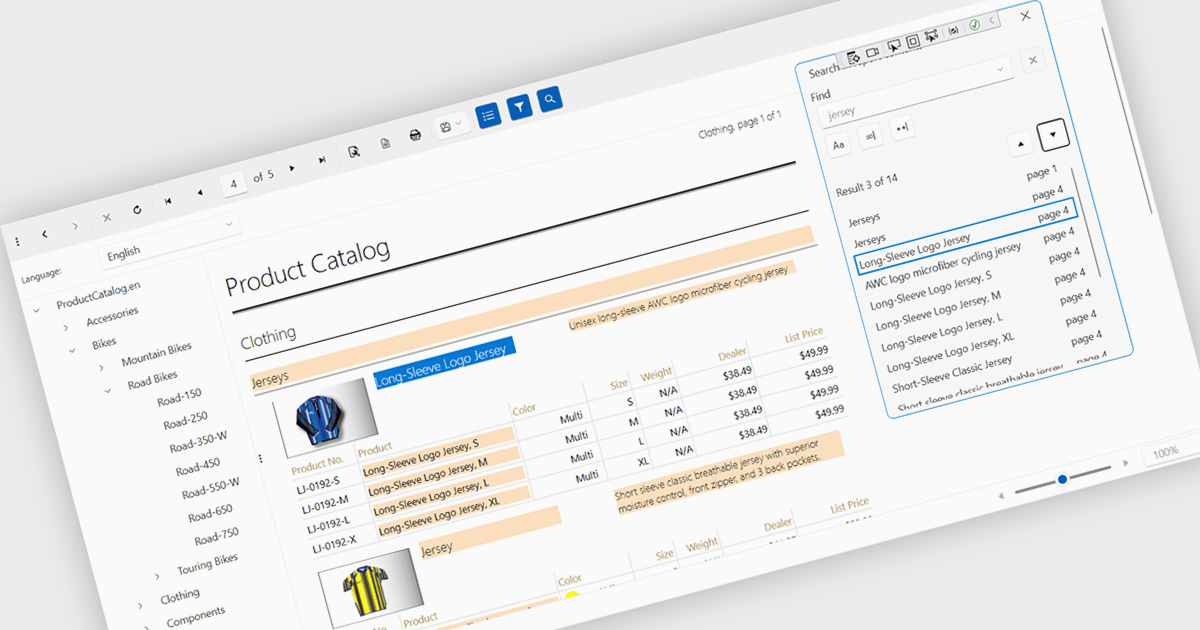
A report viewer is a control that displays rendered reports to the user. It handles the presentation of report data, enabling functionalities like zooming, pagination, searching and exporting to various formats. Essentially, it abstracts the complexity of report rendering and interaction, providing developers with a ready-to-use interface for presenting reports within their applications, thus streamlining development and ensuring a consistent user experience for report consumption.
Several reporting controls feature a WPF report viewer including:
For an in-depth analysis of features and price, visit our WPF Reporting Controls comparison.
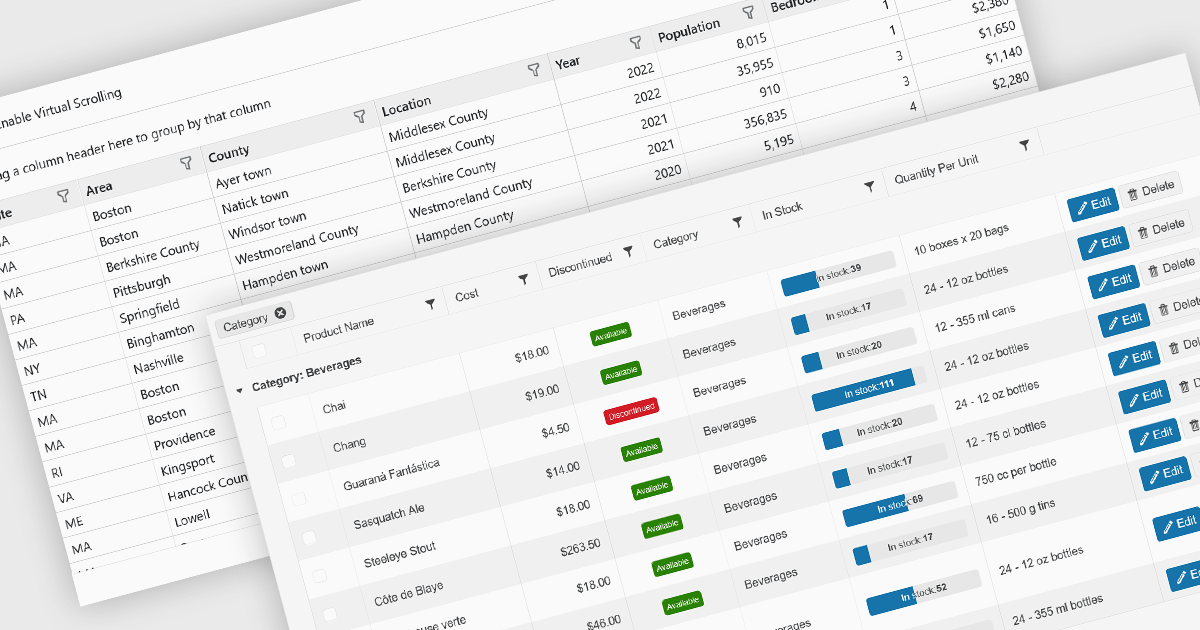
Data grids are essential components in modern user interface (UI) suites, enabling developers to display, manage, and manipulate large sets of data efficiently. They provide features such as sorting, filtering, grouping, and pagination, which enhance the user experience and improve data navigation. Advanced data grids also support customizable templates, responsive layouts, and integration with various data sources, making them highly versatile for enterprise-level applications.
Several Blazor UI suites offer data grid components including:
For an in-depth analysis of features and price, visit our Blazor UI suites comparison.
Telerik UI for ASP.NET AJAX is a library of over 120 user interface components designed for developers building Web Forms applications on the ASP.NET AJAX framework. It provides a variety of pre-built and high-performant controls which are fully customizable, ranging from data management to layout, navigation and data visualization. This feature-rich suite allows for the creation of responsive and visually appealing web applications, whilst enabling developers to enhance the user experience and expedite the development process.
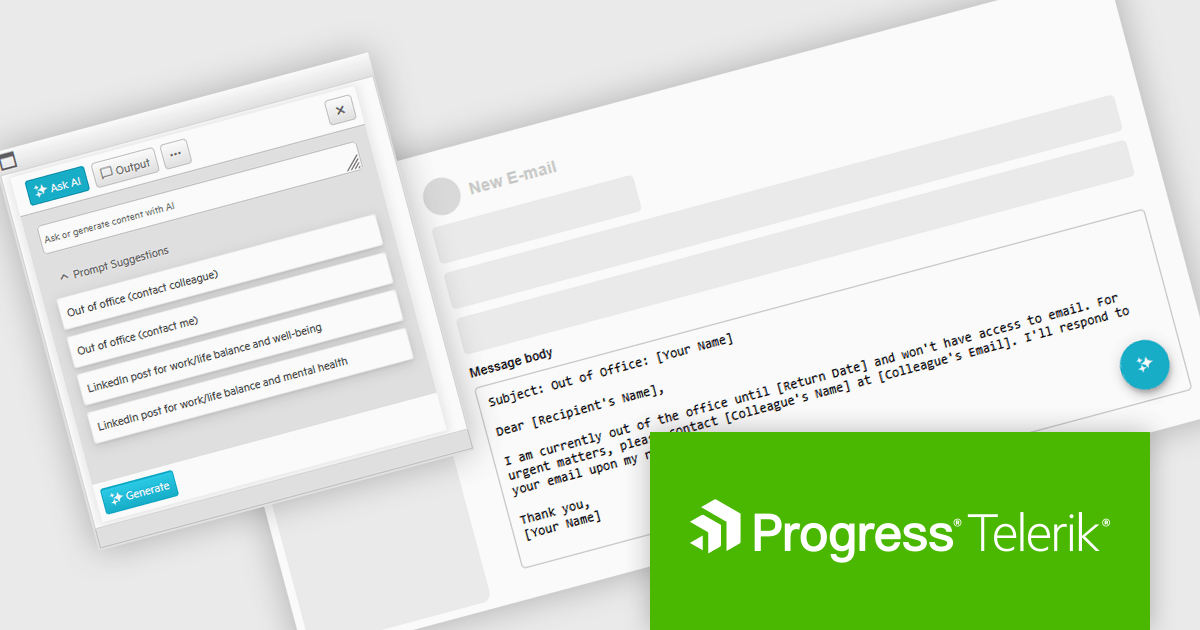
The Telerik UI for AJAX 2025 Q1 update introduces Artificial Intelligence integration, enabling developers to seamlessly incorporate generative AI capabilities into WebForms applications. The new AI Prompt control allows applications to send prompts, process AI-generated responses, and map them dynamically to UI elements or business logic. This integration streamlines AI-powered interactions, reducing development complexity while enhancing user engagement. With built-in support for prompt handling and response customization, developers can efficiently implement AI-driven features without relying on external libraries, ensuring a more intuitive and modern user experience within existing WebForms projects.
To see a full list of what's new in 2025 Q1 (2025.1.211), see our release notes.
Telerik UI for ASP.NET AJAX is licensed per developer and has two licensing models: an annual Subscription License and a Perpetual License. The Subscription license provides access to the latest product updates, technical support, and exclusive benefits for a flat annual fee, and must be renewed to continue using the software. The Perpetual license is a one-time purchase granting access to the current released version and includes a one-year subscription for product updates and technical support. After this initial period, users can choose to renew the subscription element to continue receiving updates and support; otherwise, they may continue using the installed version available during their active subscription term but will forgo future updates and support. See our Telerik UI for ASP.NET AJAX licensing page for full details.
Telerik UI for ASP.NET AJAX is available individually or as part of the following products:
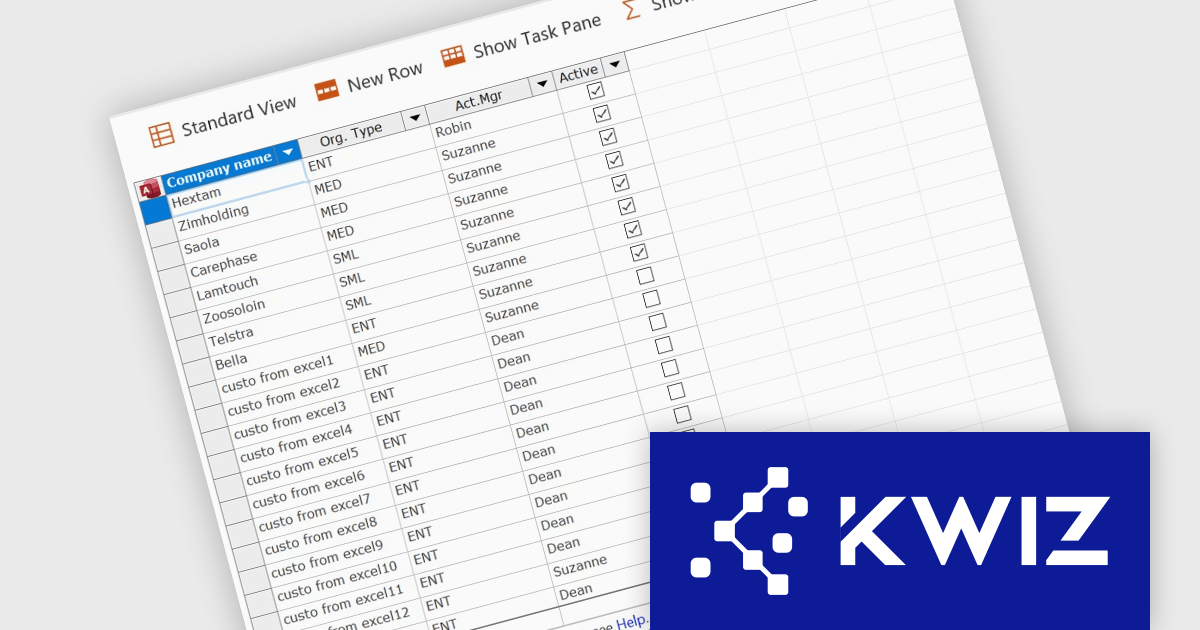
KWIZ has introduced KWIZ Datasheet View, a new product designed to streamline the way users interact with structured data in a collaborative environment. It brings an Excel-like editing experience to SharePoint, enabling fast bulk updates for modern and classic lists. It integrates seamlessly with SharePoint, adding a toolbar button for easy access and supporting Chrome, Edge, and Internet Explorer. With an option to auto-open lists in Datasheet mode, it streamlines data management for teams handling large datasets, inventory, or projects, enhancing efficiency and productivity.
KWIZ Datasheet View enhances SharePoint integration by providing a seamless, Excel-like bulk editing experience directly within SharePoint lists and libraries. This integration ensures compatibility with both modern and classic lists, allowing developers to maintain a consistent user experience across different SharePoint environments without additional configuration. By embedding directly into the SharePoint interface, it eliminates the need for external tools or complex workarounds, improving data management efficiency. The integration also supports multiple browsers, ensuring accessibility across different platforms. Developers can leverage this functionality to optimize workflows, streamline bulk data updates, and enhance usability for end users working with large datasets in SharePoint.
KWIZ Datasheet View is licensed on an annual basis, requiring each user in your organization to be covered by an Annual Subscription license. Different levels are available to cater for different numbers of users. See our KWIZ Datasheet View licensing page for full details.
For more information, visit our KWIZ Datasheet View product page.
전화 : 00798 14 800 6332
팩스 : +1 770 250 6199


