













공식 공급 업체
200 이상의 소프트웨어 개발처와 판매 계약을 맺은 공인 디스트리뷰터로서 합법적인 라이선스를 제공합니다.
모든 브랜드 보기.
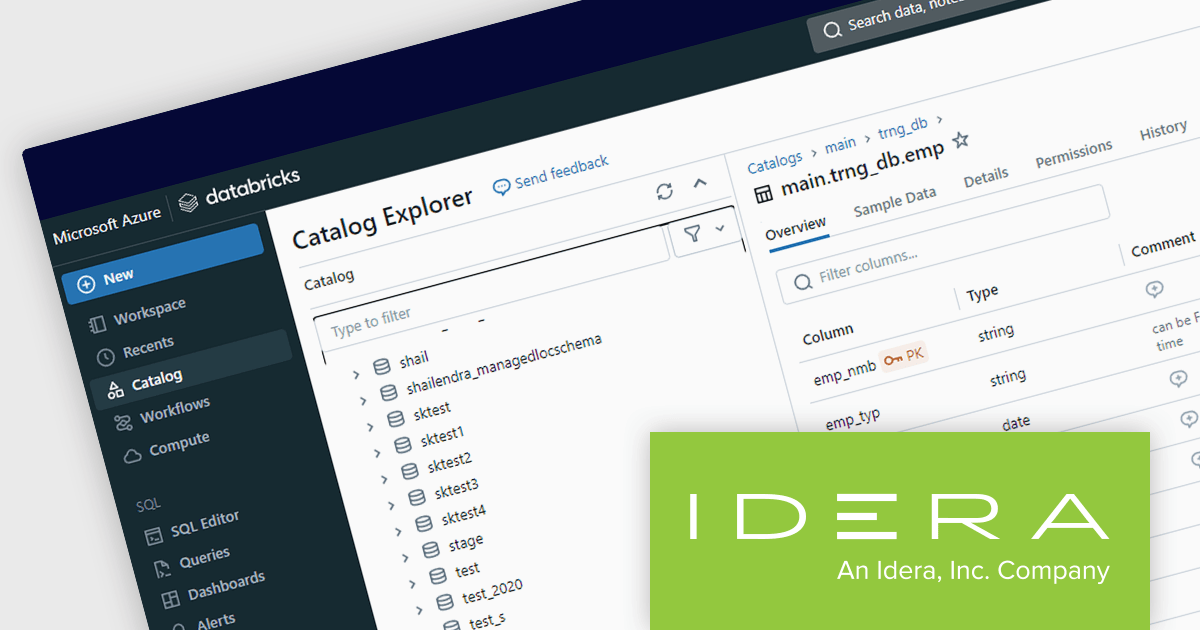
ER/Studio Data Architect is a software suite designed for data modeling and database design. It allows users to create visual representations of data structures, translating complex information into clear business models. ER/Studio offers features for both conceptual and physical data modeling, supporting a variety of databases. This comprehensive approach helps organizations improve data quality, manage database changes, and ensure data remains consistent and accessible across the enterprise.
The ER/Studio Data Architect 20.2 update adds native integration and support for Databricks, streamlining data modeling workflows for Databricks users. This new integration enables software developers to perform reverse engineering directly from the Unity Catalog, facilitating the creation of accurate data models from existing Databricks databases. ER/Studio Data Architect 20.2 also allows for forward engineering through DDL scripts and direct database connections, providing a cohesive environment for designing, documenting, and deploying data models within the Databricks ecosystem. By offering native integration and support for Databricks Unity Data Catalog and its latest features, ER/Studio ensures that users can effectively work with Delta Lake tables across all cloud platforms.
To see a full list of what's new in 20.2, see our release notes.
ER/Studio Data Architect is licensed per user and is available as a Workstation User License, Network Named License, or Concurrent User License. The Workstation option is perfect for individual users; while the network-based named and concurrent licensing options provide a flexible, cost-effective solution for organizations with a larger number of users, who want the ability to share and manage a pool of licenses. See our ER/Studio Data Architect licensing page for full details.
Learn more on our ER/Studio Data Architect product page.

A pivot grid is a data visualization tool that allows users to interactively explore and summarize multidimensional data. By dragging and dropping fields between rows, columns, and filters, developers can empower users to dynamically create custom views of their data, facilitating data analysis and informed decision-making without writing complex queries.
Several React UI suites feature a pivot grid control including:
For an in-depth analysis of features and price, visit our React UI Suites comparison.
ActiveReports.NET from MESCIUS (formerly GrapeCity) is a comprehensive reporting solution for developers building applications in the .NET framework. It empowers you to design and deliver visually appealing reports through user-friendly designers and a wide range of controls. ActiveReports simplifies report creation and distribution with a versatile API, rich data source connectivity, and support for multiple export formats. This translates to increased developer productivity and improved end-user experience with powerful reporting functionalities within your .NET applications.
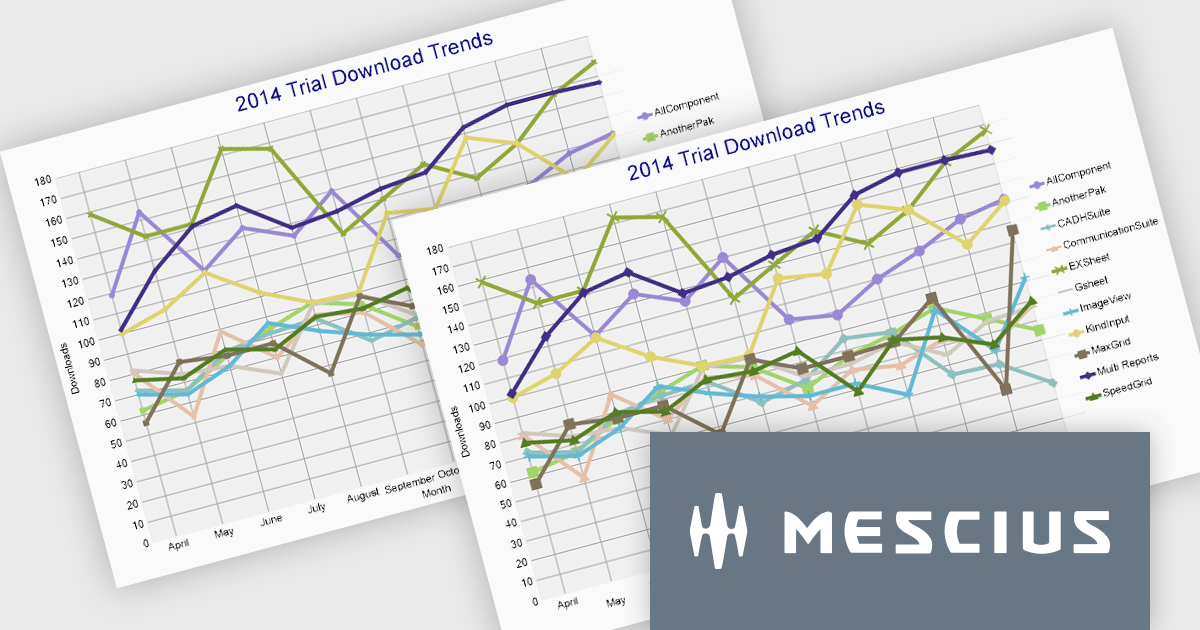
The ActiveReports.NET 18.1 update adds additional attributes to improve the customization and visual representation of charts in RDLX, Page, and Dashboard reports. The new LabelRowCount property, applies to the X-axis of charts and allows you to choose the number of rows for axis labels, enabling multi-row layouts for improved label display and organization. The new SymbolSize property allows you to change the size of plot symbols, giving you more control over chart data presentation. It is compatible with the following chart types: Line chart, Radar line chart, Radar scatter chart, Radar bubble chart, Scatter chart, and Bubble chart. These modifications are intended to improve the clarity and adaptability of chart displays within your .NET Report applications.
To see a full list of what's new in 18.1, see our release notes.
ActiveReports.NET is licensed per developer and is available with or without a 12 month support and maintenance subscription. See our ActiveReports.NET licensing page for full details.
Learn more on our ActiveReports.NET product page.
Syncfusion Essential Studio Blazor (available as part of Syncfusion Essential Studio Enterprise) is a comprehensive UI component library designed to accelerate the development of high-performance, modern web applications using the Blazor framework. It boasts over 85+ responsive, lightweight, and modular components spanning various categories such as data visualization, data editing, document processing, and interactive UI elements. This rich repertoire empowers developers to rapidly build user-friendly, feature-rich web interfaces, with seamless integration of both server-side and client-side Blazor applications.
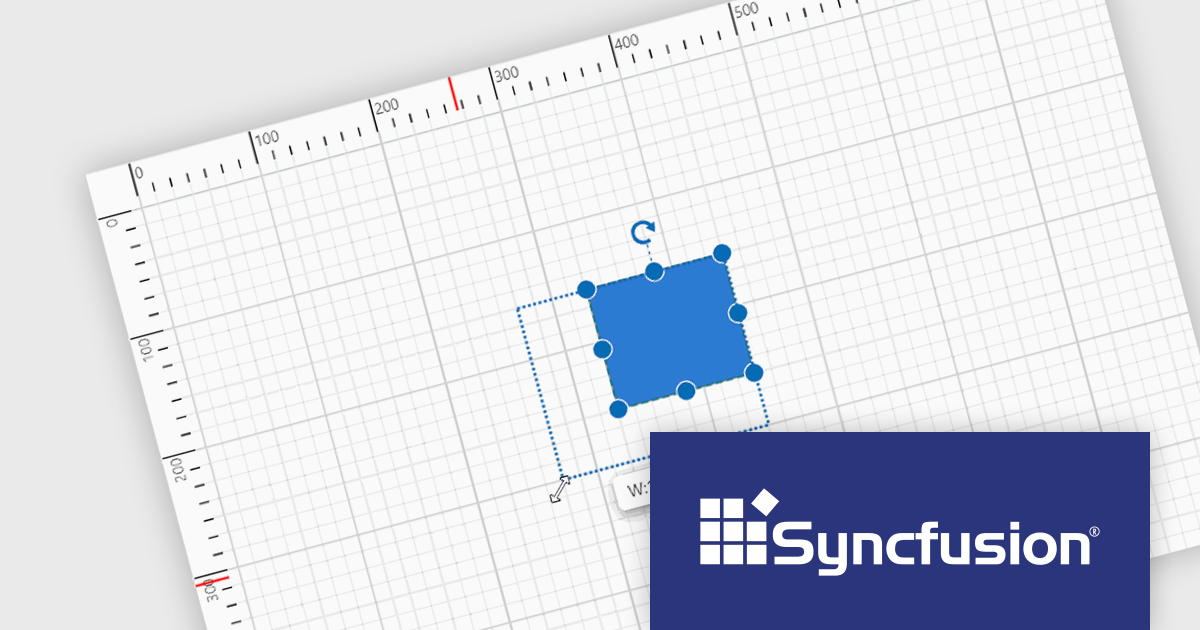
The Syncfusion Essential Studio Blazor 2024 Volume 2 (26.1.35) release introduces a ruler for the Diagram component, enhancing precision and simplifying element arrangement. This ruler provides both horizontal and vertical guides, allowing for visual measurement of object dimensions, indication of element positions, and alignment of various components. This significantly streamlines the creation of accurate and well-proportioned diagrams, particularly for tasks like crafting scale models.
To see a full list of what's new in 2024 Volume 2 (26.1.35), see our release notes.
Syncfusion Essential Studio Blazor is available as part of Syncfusion Essential Studio Enterprise which is licensed per developer starting with a Team License of up to five developers. It is available as a 12 Month Timed Subscription License which includes support and maintenance. See our Syncfusion Essential Studio Enterprise licensing page for full details.
Learn more on our Syncfusion Essential Studio Blazor product page.
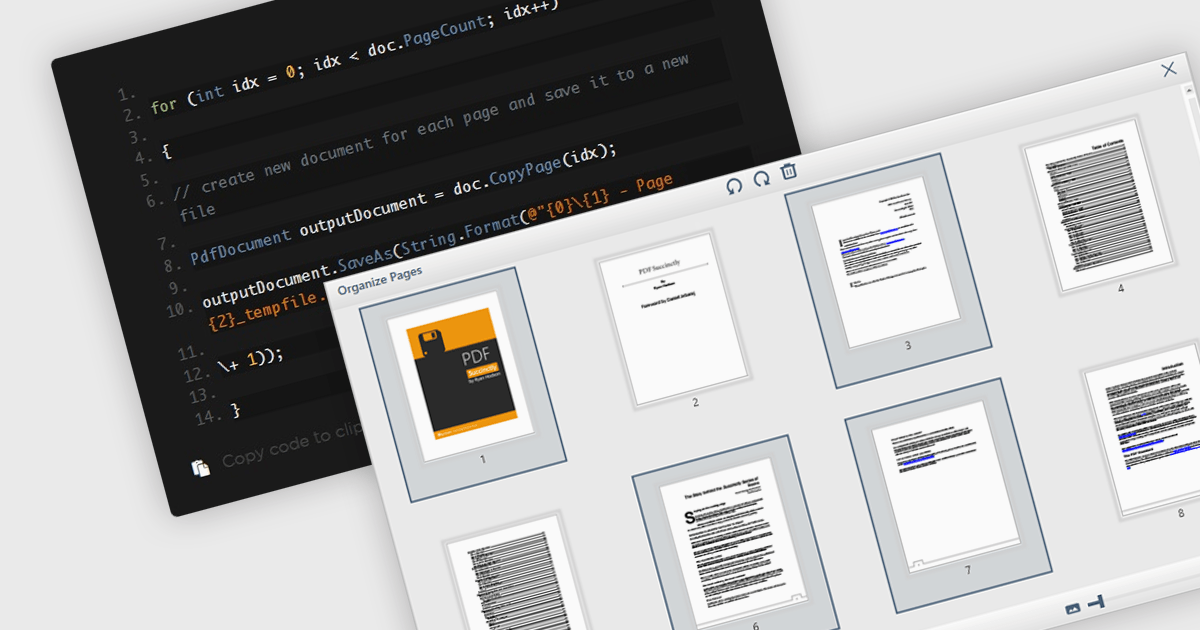
Extracting pages from PDFs offers significant advantages for streamlined workflows and information management. It allows users to focus on specific sections of a document for targeted reading or sharing, reduces file size when sending only relevant content, and simplifies the creation of new documents from existing PDFs, ultimately boosting productivity and enhancing document organization.
Several WPF PDF components offer the ability to extract pages from a PDF file including:
For an in-depth analysis of features and price, visit our WPF PDF Components comparison.
전화 : 00798 14 800 6332
팩스 : +1 770 250 6199


