


공식 공급 업체
200 이상의 소프트웨어 개발처와 판매 계약을 맺은 공인 디스트리뷰터로서 합법적인 라이선스를 제공합니다.
모든 브랜드 보기.
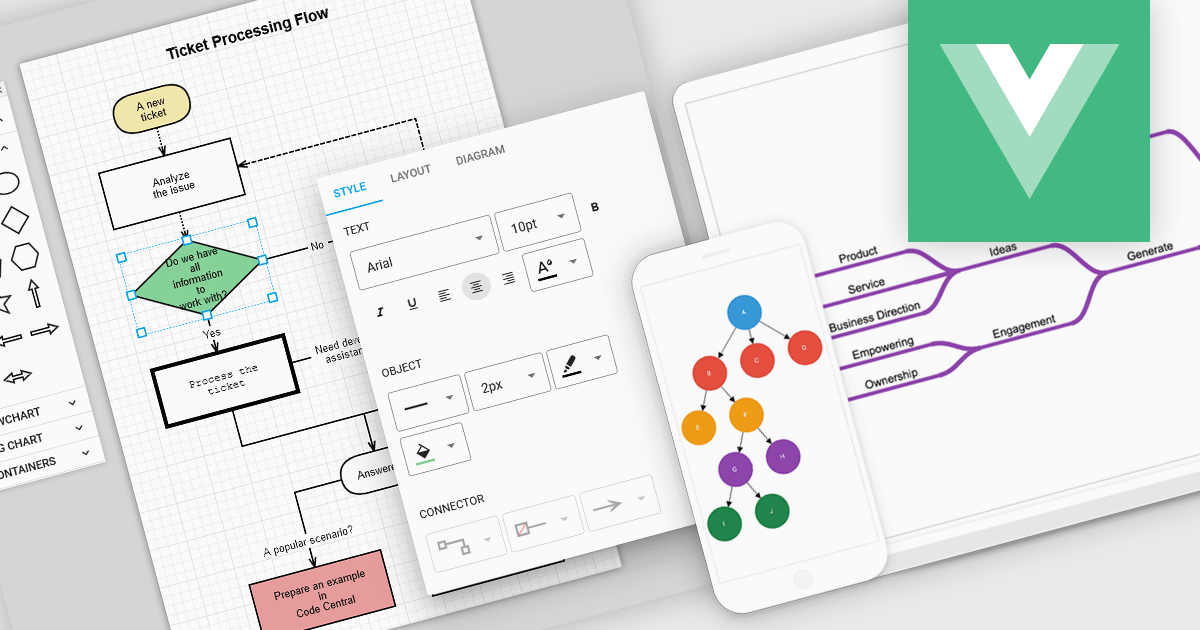
Vue diagrams are interactive visual representations, used to illustrate complex data structures, workflows, or system architectures. They leverage Vue's reactivity and component-based architecture to dynamically update as data changes, providing developers with an intuitive way to display and manage intricate relationships in real-time. Vue diagrams enhance the clarity of application logic, simplify debugging, and improve user experience by offering a clear, visual way to represent processes or data flows. This ultimately leads to more efficient development and better communication of complex concepts within the application.
Several Vue.js UI suites offer diagram controls including:
For an in-depth analysis of features and price, visit our Vue js UI suite comparison.
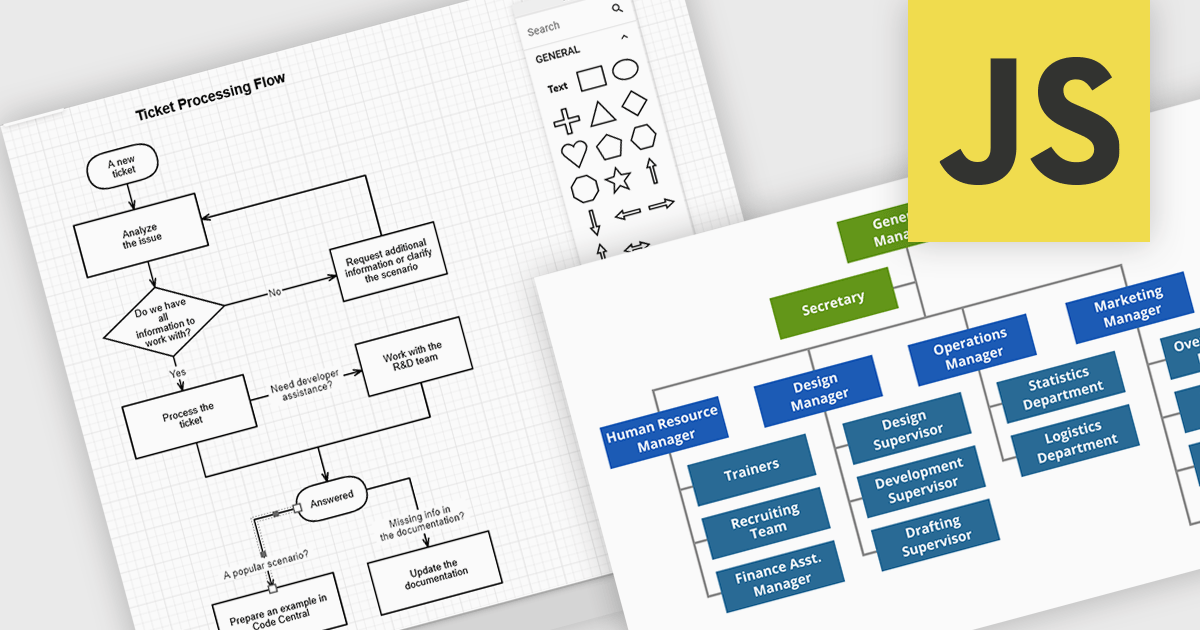
JavaScript diagramming components are libraries that enable developers to create interactive and dynamic diagrams in web applications. By offering customizable elements like nodes and connectors, they simplify the visualization of complex data, workflows, and processes. These components save development time and enhance user experience with pre-built tools for creating diagrams without the need for manual graphics handling. Common use cases include business process modeling, network architecture visualization, and organizational charts, making them ideal for applications requiring dynamic content and real-time collaboration.
Several JavaScript UI suites offer diagramming controls including:
For an in-depth analysis of features and price, visit our JavaScript UI suites comparison.
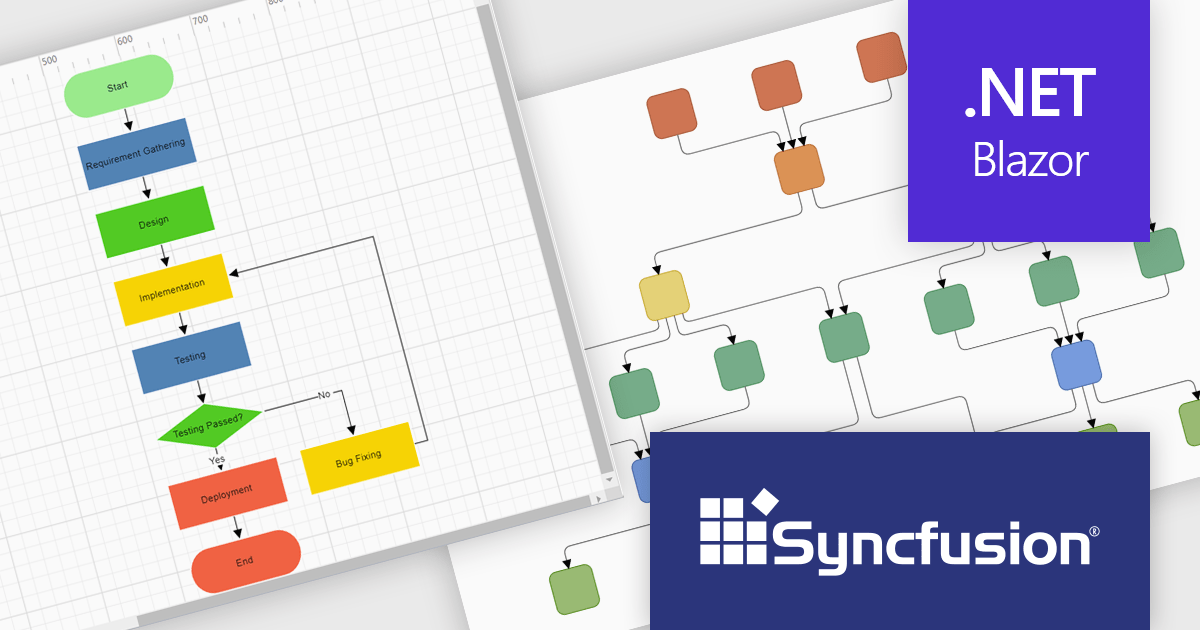
Syncfusion Essential Studio Blazor (available as part of Syncfusion Essential Studio Enterprise) is a comprehensive UI component library designed to accelerate the development of high-performance, modern web applications using the Blazor framework. It boasts over 85+ responsive, lightweight, and modular components spanning various categories such as data visualization, data editing, document processing, and interactive UI elements. This rich repertoire empowers developers to rapidly build user-friendly, feature-rich web interfaces, with seamless integration of both server-side and client-side Blazor applications.
The Syncfusion Essential Studio Enterprise 2024 Volume 3 release introduces the ability to automatically generate clear, logical, and visually appealing flowcharts by arranging nodes and connectors using an advanced layout algorithm. The feature saves time by automating flowchart creation, ensures clarity with logical layouts, enhances visual appeal, and adapts seamlessly to various data inputs, improving overall efficiency.
To see a full list of what's new in 2024 Volume 3, see our release notes.
Syncfusion Essential Studio Blazor is available as part of Syncfusion Essential Studio Enterprise which is licensed per developer starting with a Team License of up to five developers. It is available as a 12 Month Timed Subscription License which includes support and maintenance. See our Syncfusion Essential Studio Enterprise licensing page for full details.
Learn more on our Syncfusion Essential Studio Blazor product page.
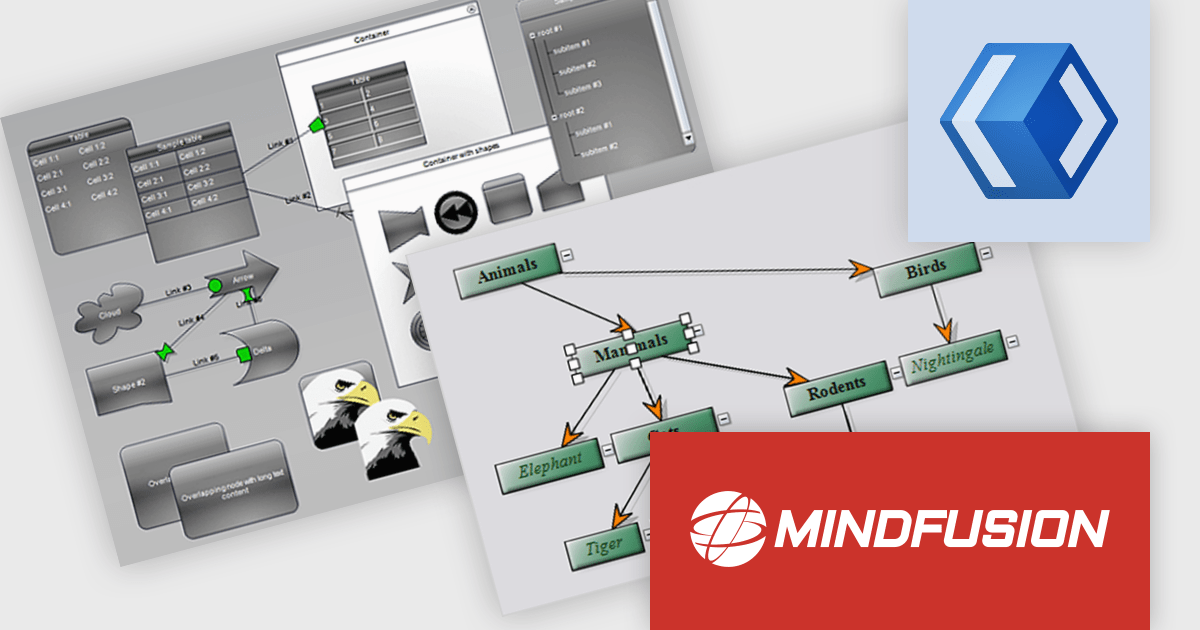
MindFusion.Diagramming for WinUI is a comprehensive diagramming library designed to empower developers to create visually stunning and interactive diagrams within their WinUI applications. This versatile tool offers a rich set of features, including support for various diagram types and several customization options. With MindFusion.Diagramming, developers can effortlessly incorporate diagrams into their applications to enhance user engagement and improve data visualization.
MindFusion.Diagramming for WinUI can be used to create a wide range of diagrams, such as flowcharts, UML diagrams, organizational charts, and network diagrams. The library's extensive customization capabilities allow developers to tailor diagrams to their specific needs, ensuring that they align with the application's overall design and branding. MindFusion.Diagramming integrates seamlessly with other WinUI components, enabling developers to create complex and interactive user interfaces with ease. Whether you're building business applications, educational tools, or creative software, MindFusion.Diagramming offers a powerful and flexible solution for incorporating diagramming functionality into your WinUI projects.
MindFusion.Diagramming for WinUI is licensed per developer and is available as a perpetual license with 1 year subscription and support. See our MindFusion.Diagramming for WinUI licensing page for full details.
For more information, visit our MindFusion.Diagramming for WinUI product page.
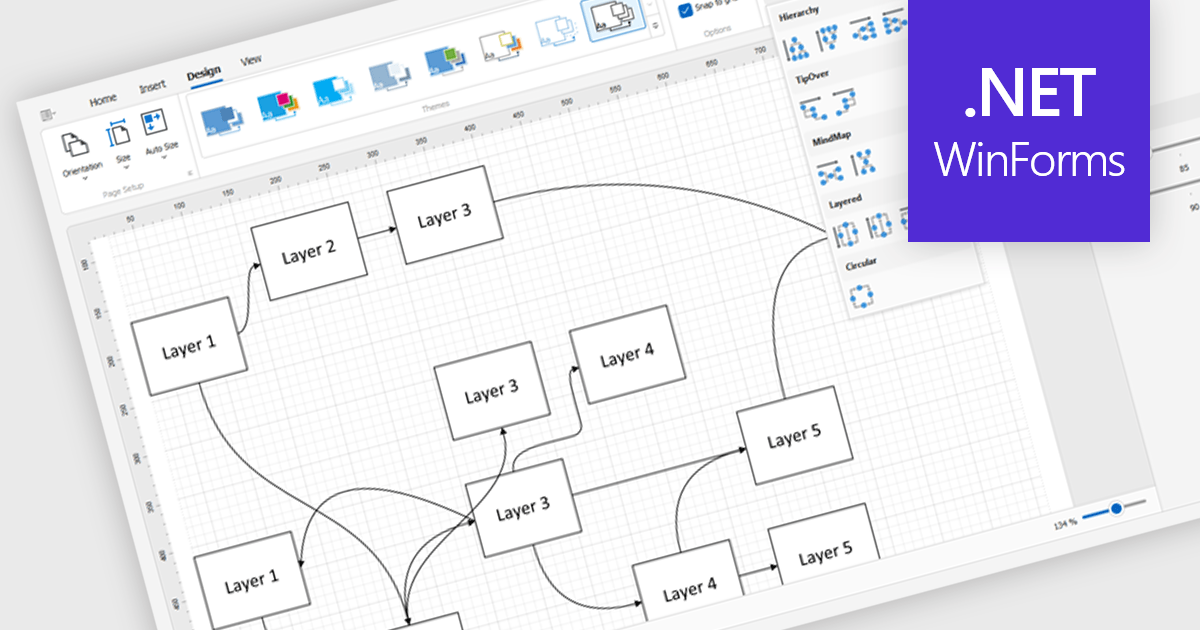
Diagram controls provide pre-built graphical elements for constructing various diagrams, flowcharts, and organizational charts within applications. These components accelerate development by offering customizable shapes, connectors, layouts, and interaction features, enabling developers to rapidly create visually appealing and interactive diagrams without extensive manual coding, thereby enhancing user experience and application functionality.
Many .NET WinForms UI Suite collections contain diagram controls including:
For an in-depth analysis of features and price, visit our comparison of .NET WinForms UI Suites.
전화 : 00798 14 800 6332
팩스 : +1 770 250 6199


