


공식 공급 업체
200 이상의 소프트웨어 개발처와 판매 계약을 맺은 공인 디스트리뷰터로서 합법적인 라이선스를 제공합니다.
모든 브랜드 보기.
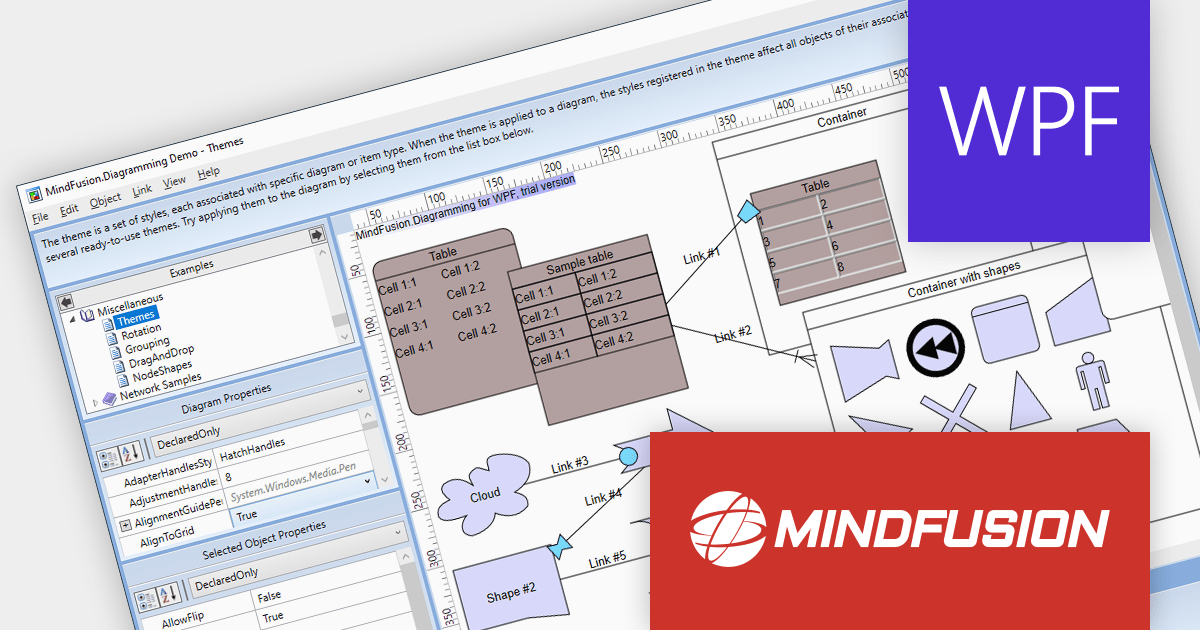
MindFusion.Diagramming for WPF provides a comprehensive toolset for creating a wide array of diagrams, including organizational charts, graphs, class hierarchies, and family trees. It offers extensive customization options for appearance and behavior, as well as save/load options and several automatic layouts.
Version 4.0.0 adds support for asynchronous serialization, which means that files can now be saved and loaded asynchronously. This allows users to interact with the application while data is being loaded or saved, making it feel more responsive.
To see a full list of what's new in version 4.0.0, see our release notes.
For more information, visit our MindFusion.Diagramming for WPF product page.

OrgChart JS is a visual tool that helps managers illustrate the roles and hierarchy of an organization. It supports a variety of features, including grouping, assistant nodes, expand/collapse, search, performance, and multi-format exports for example to PDF, PNG, SVG or CSV.
The v8.12.13 release of OrgChart JS introduces undo/redo functionality, allowing users to easily reverse or repeat actions like adding or removing nodes, even after saving the chart. The undo/redo stack can be cleared to remove unnecessary steps or start fresh. Additionally, the number of steps in the stack can be checked for a clear overview of the history. Undo/redo history is stored in the browser's session storage, ensuring actions remain available even after refreshing or closing the browser. For extra security, this history can optionally be saved to a database, providing a permanent record of changes.
To see a full list of what's new in v8.12.13, see our release notes.
For more information, see our OrgChart JS product page.

MindFusion.Diagramming for JavaScript allows you create flow diagrams using predefined node shapes. You can use links to join nodes together and users can create, resize, select, move and modify nodes and links as needed. All diagram elements can be accessed programmatically and methods are available to changing the appearance of all elements.
The version 4.4 release has been extended to include support for animations. Diagram items support the animation of fill color, stroke color and opacity. Diagram nodes can now include bounce, shake, pulse and path animations. The diagram view itself now offers animated zooming and scrolling.
To see a full list of what's new in version 4.4, see our release notes.
For more information, visit our MindFusion.Diagramming for JavaScript product page.

MindFusion.Diagramming for WinForms is a component that provides a variety of features for creating and editing diagrams. It supports a wide variety of diagram types, including flowcharts, UML diagrams, organizational charts and more.
The new release adds multi-touch support to its diagram views. This means that users can now use two or more fingers to zoom, pan and rotate diagrams, as well as move, scale, and rotate nodes. Multi-touch support makes it easier to interact with diagrams on touch screens, such as tablets and laptops.
The multi-touch support is highly customizable. For example, developers can specify which gestures are enabled, as well as the sensitivity of each gesture. Developers can also create custom gestures to meet their specific needs.
To see a full list of what’s new in version 7.0.0, see our release notes.
For more information, visit our MindFusion.Diagramming for WinForms product page.
전화 : 00798 14 800 6332
팩스 : +1 770 250 6199


