


공식 공급 업체
200 이상의 소프트웨어 개발처와 판매 계약을 맺은 공인 디스트리뷰터로서 합법적인 라이선스를 제공합니다.
모든 브랜드 보기.

A pivot grid is a data visualization tool that allows users to interactively explore and summarize multidimensional data. By dragging and dropping fields between rows, columns, and filters, developers can empower users to dynamically create custom views of their data, facilitating data analysis and informed decision-making without writing complex queries.
Several React UI suites feature a pivot grid control including:
For an in-depth analysis of features and price, visit our React UI Suites comparison.
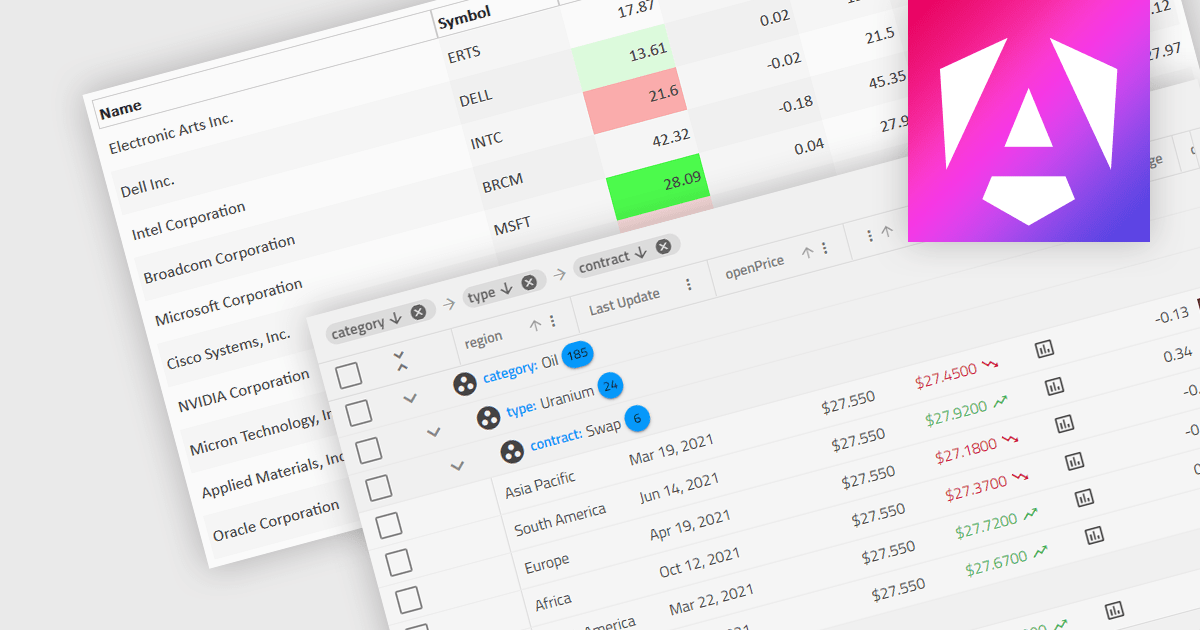
Dynamic updates, or live data rendering, in a data grid is the capability of the grid to automatically refresh and display updated data without the need for manual intervention or full-page reloads. This provides immediate access to the most current data and gives real-time reflections of changes. It therefore improves the user experience, enhancing data accuracy, and minimizing disruptions during data manipulation. Live data reduces the load on network resources by fetching only incremental data changes, and minimizes the computational burden on the client side, improving overall performance. This functionality is critical in applications where real-time data visibility is essential, such as in financial dashboards, live monitoring systems, or inventory management applications.
Several Angular grid components support dynamic updates, including:
For an in-depth analysis of features and price, visit our comparison of Angular grid components.
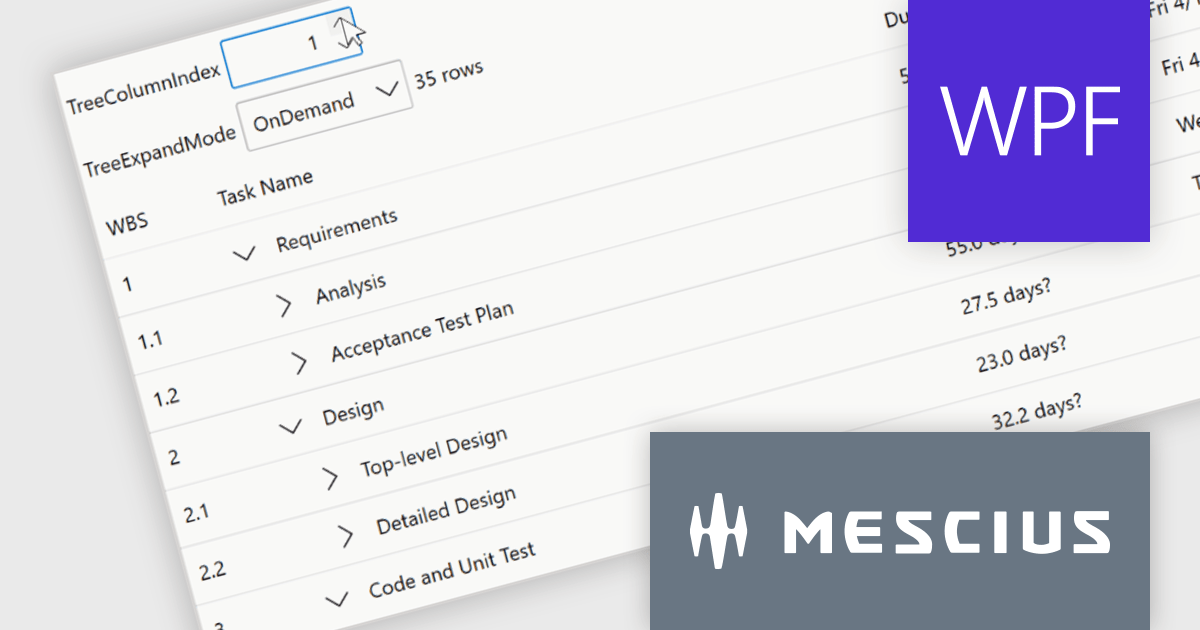
ComponentOne Studio WPF by MESCIUS is a comprehensive suite of controls designed to enhance the development of WPF applications. It offers a range of powerful and flexible UI components such as data grids, charts, and data visualization tools that integrate seamlessly into WPF projects. This suite enables developers to create modern, responsive, and visually appealing applications with greater efficiency, leveraging robust features and customization options. Its components are optimized for performance and ease of use, allowing for the rapid development of high-quality WPF applications that meet complex business requirements.
The ComponentOne Studio WPF 2024 v1 update introduces a new TreeGrid feature to FlexGrid for WPF, enabling developers to visualize and manage hierarchical data structures directly within the familiar FlexGrid interface. This eliminates the need for separate TreeView controls, streamlining development and improving data presentation clarity for applications that handle nested information. TreeGrids excel at displaying data with inherent parent-child relationships, making them ideal for visualizing nested structures like file systems, organizational charts, product categories with subcategories, or threaded comments.
To see a full list of what's new in 2024 v1, see our release notes.
ComponentOne Studio WPF is licensed per developer on a perpetual basis and includes a 12 month subscription. See our ComponentOne Studio WPF licensing page for full details.
Learn more on our ComponentOne Studio WPF product page.
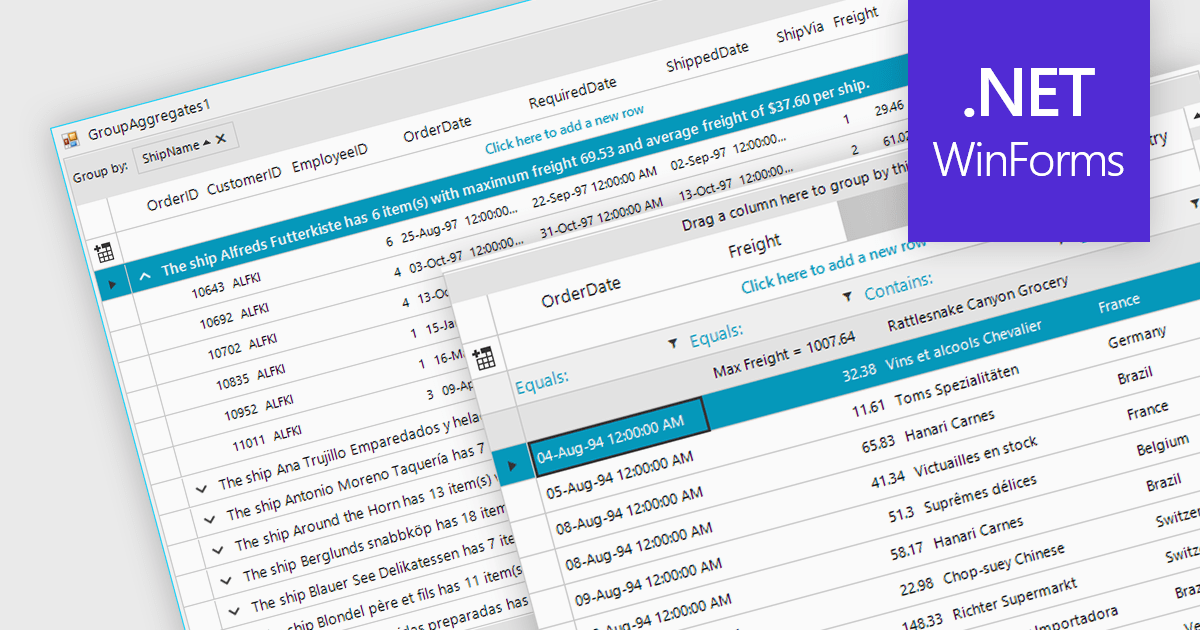
Aggregation in is the process of summarizing or combining multiple data points into a single value to provide a comprehensive overview of the dataset. Commonly used in grids, this technique can include operations such as calculating sums, averages, counts, minimums, and maximums, and is crucial for efficiently analyzing large volumes of data. It enhances data interpretability by reducing complexity, allowing users to quickly identify trends, patterns, and outliers. It can also improve performance by reducing the amount of data that needs to be processed and displayed, making it easier to manage and interact with extensive datasets.
Several WinForms grid components support aggregation, including:
For an in-depth analysis of features and price, visit our comparison of WinForms grid components.
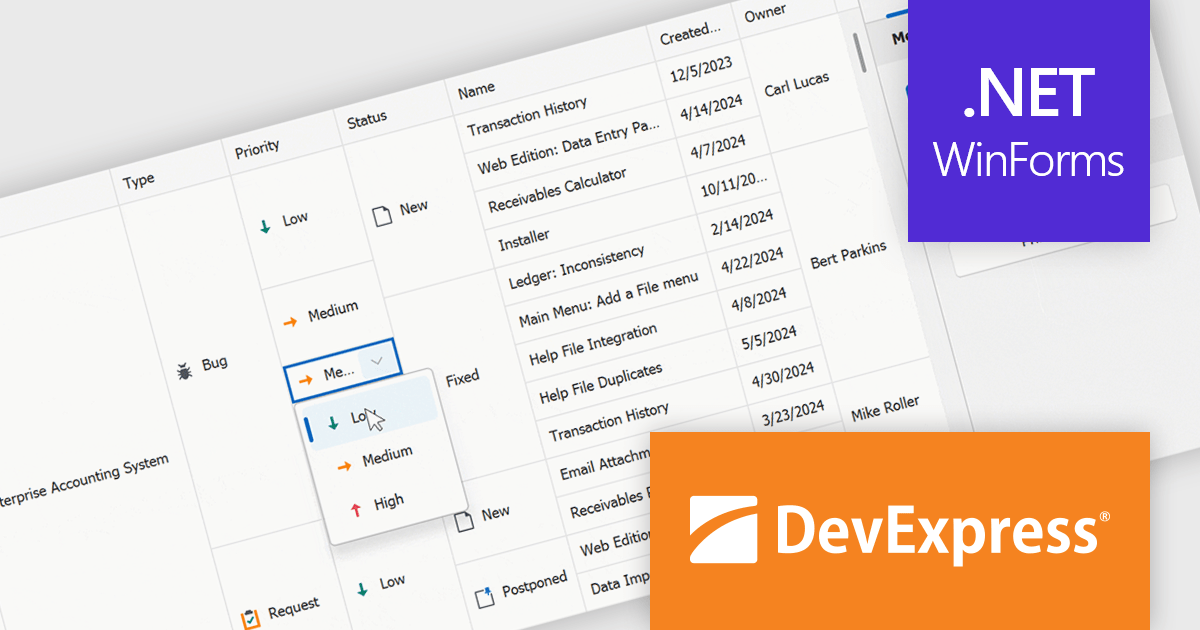
DevExpress WinForms is a comprehensive suite of 190+ UI controls and development tools designed for building high-performance desktop applications. It offers a broad array of customizable controls, from data grids and ribbon interfaces to advanced charts, maps, and diagramming components. This empowers developers to rapidly create functionally rich applications, while adhering to accessibility guidelines and touch-enabled technology for modern Windows environments.
The DevExpress WinForms 24.1 release introduces a powerful new feature for working with merged cells in the GridView and BandedGridView controls: merged cell editing. This enhancement empowers users to edit data with increased flexibility. They can now either modify all values within a merged range simultaneously, ideal for maintaining consistency across related data points, or edit individual cells within the merged area, perfect for scenarios where specific values require unique changes. This improved functionality caters to a wider range of data structures and editing workflows, boosting overall productivity and efficiency.
To see a full list of what's new in version 24.1, see our release notes.
DevExpress WinForms is licensed per developer and is available as a Perpetual License with a 12 month support and maintenance subscription. See our DevExpress WinForms licensing page for full details.
DevExpress WinForms is available to buy in the following products:
전화 : 00798 14 800 6332
팩스 : +1 770 250 6199


