


공식 공급 업체
200 이상의 소프트웨어 개발처와 판매 계약을 맺은 공인 디스트리뷰터로서 합법적인 라이선스를 제공합니다.
모든 브랜드 보기.
DevExtreme Complete is a robust suite of tools by DevExpress designed to streamline the development of high-performance web applications. It includes a wide range of UI components for modern frameworks such as Angular, React, Vue, and jQuery, making it ideal for developers aiming to create responsive, cross-platform applications with ease. With features like rich data visualization, interactive grids, form controls, and adaptive layouts, it empowers developers to deliver polished and user-friendly interfaces. Whether you're building enterprise dashboards or consumer-facing apps, DevExtreme Complete provides the flexibility and power to meet complex requirements while maintaining performance and usability.
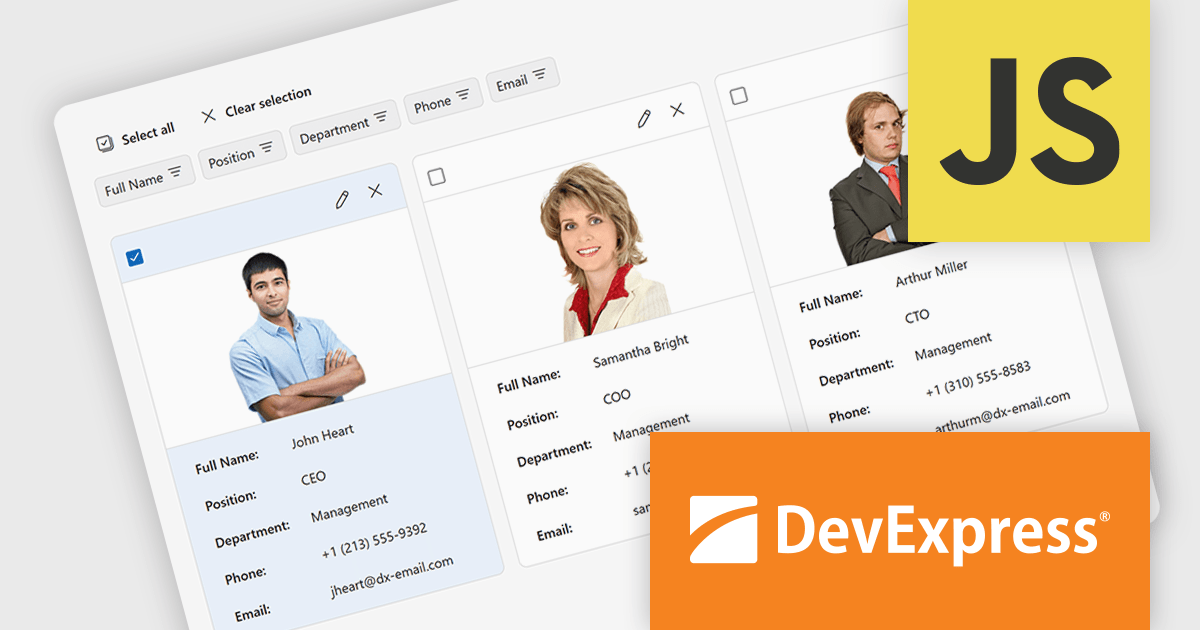
The DevExtreme Complete v25.1 release adds a new CardView component, which presents data in a card-based layout instead of the traditional grid format. It’s particularly suited to use cases like employee directories, contact lists, product catalogs, and task boards - any scenario where visual content such as images plays a central role. Each card includes a toolbar, cover image, main content area, and footer, all of which can be modified using the component's public API. This gives developers the flexibility to adapt the layout and behavior of CardView to meet specific application requirements.
To see a full list of what's new in version v25.1, see our release notes.
DevExtreme Complete is licensed per developer and is available as a Perpetual License with a 12 month support and maintenance subscription. See our DevExtreme Complete licensing page for full details.
DevExtreme Complete is available to buy individually or as part of the following products:

LightningChart Python is a high-performance visualization library designed for real-time analytics and large-scale data rendering. Utilizing GPU acceleration and WebGL, it efficiently processes millions of data points in 2D and 3D with smooth, interactive visuals. Some example chart types include Line graphs, Scatter plots, Heatmaps, Area plots, Box plots, 3D Surface graphs and Mesh plots, and it supports UI elements such as CustomTicks, interval Bands and Constant Lines. It seamlessly integrates with Python’s data ecosystem, including numpy, pandas, and GUI frameworks like PyQt and PySide, making it a powerful tool for interactive dashboards, financial analytics, scientific simulations, and engineering applications.
The LightningChart Python v1.2 update improves multidimensional data analysis capabilities by enabling Parallel Coordinate charts to be embedded directly into dashboards, allowing developers to integrate complex data comparisons within interactive visual reporting environments. This integration simplifies the comparison of complex data sets across multiple dimensions in a unified interface, so you can see relationships, correlations, clusters, and outliers across many dimensions at once.
To see a full list of what's new in v1.2, see our release notes.
LightningChart Python offers two licensing options: the subscription-based Data Scientist License for internal, non-public facing usage and the perpetual, per-seat Software Developer License for commercial use with professional support and deployment keys. Both licenses allow one active session per user, with developer licenses assigned individually. See our LightningChart Python licensing page for full details.
For more information, see our LightningChart Python product page.

ComponentSource and SecureTeam have been trusted partners since 2010, working together to provide advanced .NET protection tools to developers worldwide. SecureTeam’s technology delivers method-level encryption, obfuscation, licensing, and anti-reverse engineering techniques, all embedded seamlessly into application code. This enables development teams to safeguard their software against piracy, intellectual property theft, and malicious tampering.
At the heart of this collaboration is Agile.NET Code Protection, SecureTeam’s flagship product. Combining obfuscation, encryption, and runtime protection to defend sensitive .NET code from decompilation and tampering, it provides developers with an accessible, effective solution to secure their applications from development to deployment.
This partnership has strengthened ComponentSource’s catalog with industry-leading security solutions tailored for professionals across the globe. Developers in sectors like finance and healthcare rely on SecureTeam’s tools to deliver safer, more resilient applications. Together, ComponentSource and SecureTeam continue to support innovation and software protection at every stage of the development lifecycle.
Agile.NET Code Protection is licensed per named user, for use by a specific individual on their personal machine. The Developer License includes 1 Year Support & Upgrades with all updates and response times up to 48 hours. Build server licenses allow multiple users on a single build server. See our Agile.NET Code Protection licensing page for full details.
For more information, visit our SecureTeam brand page.
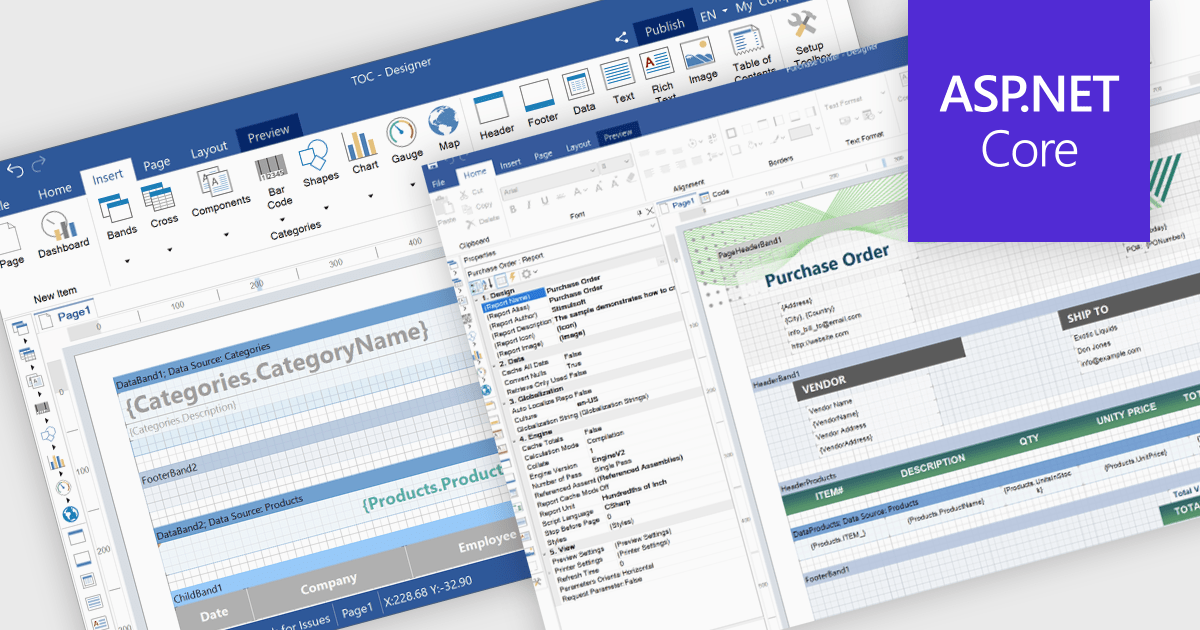
Reporting themes refers to applying consistent visual styles such as colors, fonts, and layouts across report elements to match an application's design and branding. This ensures a cohesive user experience, simplifies development through centralized style management, and supports dynamic customization such as light or dark mode. Common use cases include branded dashboards, client-specific report styling, and consistent visuals in multi-tenant SaaS platforms.
Several ASP.NET Core reporting controls offer support for themes including:
For an in-depth analysis of features and price, visit our ASP.NET Core reporting controls comparison.
Syncfusion Essential Studio WinUI (available as part of Syncfusion Essential Studio Enterprise) is a comprehensive toolkit for building high performance native Windows desktop applications. It offers tools for crafting modern UI elements like charts, data grids, and ribbon interfaces, alongside powerful editing tools for Word, Excel, and PDF documents.
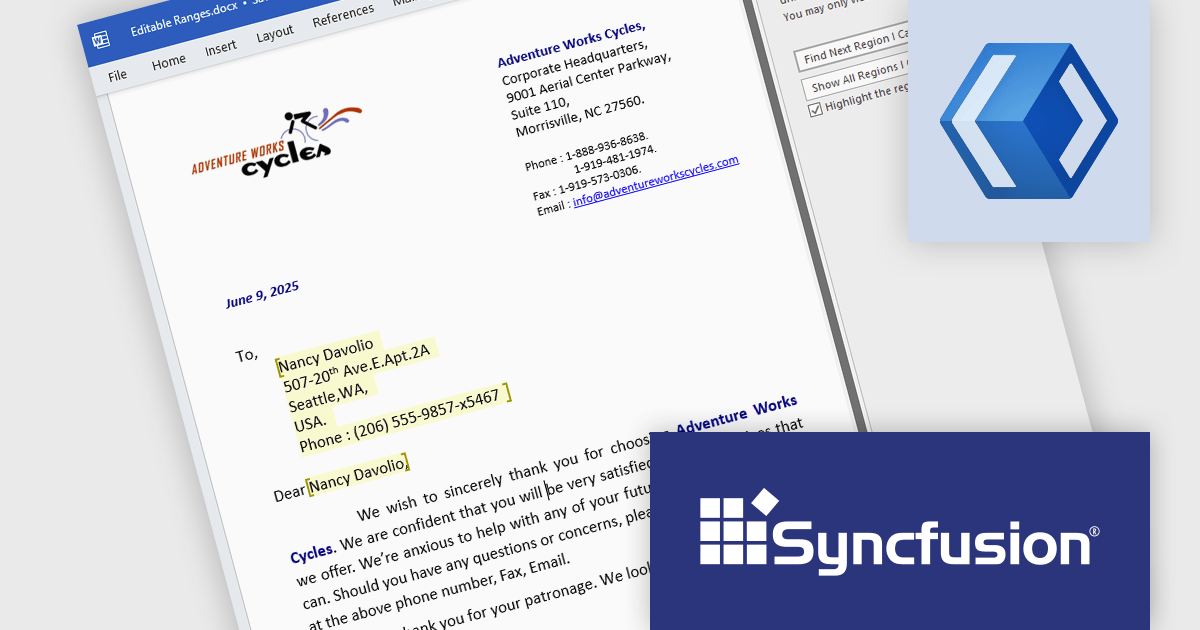
The Syncfusion Essential Studio WinUI 2025 Volume 2 release allows developers to define editable regions within protected Word documents, giving them precise control over which parts of a document users can modify. This is particularly useful for generating templates, forms, and contracts where only certain fields need to be filled in while the rest of the content remains locked. By programmatically setting these editable areas, developers can ensure document consistency, reduce the risk of accidental changes, and streamline user interaction within business applications that generate or process Word documents.
To see a full list of what's new in Syncfusion Essential Studio WinUI 2025 Volume 2 (30.1.37), see our release notes.
Syncfusion Essential Studio WinUI is available as part of Syncfusion Essential Studio Enterprise which is licensed per developer starting with a Team License of up to five developers. It is available as a 12 Month Timed Subscription License which includes support and maintenance. See our Syncfusion Essential Studio Enterprise licensing page for full details.
Learn more on our Syncfusion Essential Studio WinUI product page.
전화 : 00798 14 800 6332
팩스 : +1 770 250 6199


