


공식 공급 업체
200 이상의 소프트웨어 개발처와 판매 계약을 맺은 공인 디스트리뷰터로서 합법적인 라이선스를 제공합니다.
모든 브랜드 보기.

Grial UI Kit by UXDivers is a collection of pre-designed user interface components and templates specifically built for Xamarin.Forms and .NET MAUI app development. It offers a wide range of customizable XAML code snippets, custom controls, and helpers, allowing developers to rapidly build modern and visually appealing mobile applications for Android and iOS platforms while focusing on the core functionalities of the app.
The Grial UI Kit 2024.3 release introduces a highly requested feature: the Grial Calendar control. Designed to streamline the process of selecting dates and date ranges, this intuitive calendar is perfect for a variety of use cases. Whether you are scheduling appointments, booking events, or simply allowing users to pick dates in your .NET MAUI applications, the Grial Calendar provides a beautiful and user-friendly experience. The control is also fully customizable, giving you the freedom to style and configure it to perfectly match the look and feel of your app.
To see a full list of what's new in 2024.3, see our release notes.
Grial UI Kit is licensed per application and is available as an perpetual license. See our Grial UI Kit licensing page for full details.
For more information, see our Grial UI Kit product page.
GroupDocs.Watermark for Node.js via Java empowers developers with a powerful document watermarking solution designed to seamlessly integrate into Node.js applications. This library, leveraging the capabilities of the Java API, extends Node.js functionality to add, search for, and remove watermarks from various document formats. Supported formats include popular choices like PDF, Microsoft Office suite files (Word, Excel, PowerPoint), and common image formats (JPEG, PNG, etc.).
This robust solution offers a multitude of benefits for developers. It bolsters document security by embedding watermarks, such as text or images, to deter unauthorized copying. Customization options allow for fine-tuning watermark appearance, including font styles, opacity, and positioning within the document. GroupDocs.Watermark for Node.js via Java caters to various use cases, including protecting sensitive documents, branding presentations, and adding copyright information to images.
GroupDocs.Watermark for Node.js via Java is offered as Developer Small Business, Developer OEM, Site Small Business, and Site OEM licenses catering to a range of business needs. Licenses are perpetual, and include 1 year of support and maintenance. Subscription renewals are also available. See our GroupDocs.Watermark for Node.js via Java licensing page for full details.
GroupDocs.Watermark for Node.js via Java is available in the following products:
JetBrains Academy is an online educational platform designed to help developers advance their programming skills. It provides a holistic approach to learning in which users study the theory and immediately put it into practice by building working applications. The project-based learning environment is integrated with JetBrains IDEs, and allows developers to learn Java, Python, and other programming languages with ease.
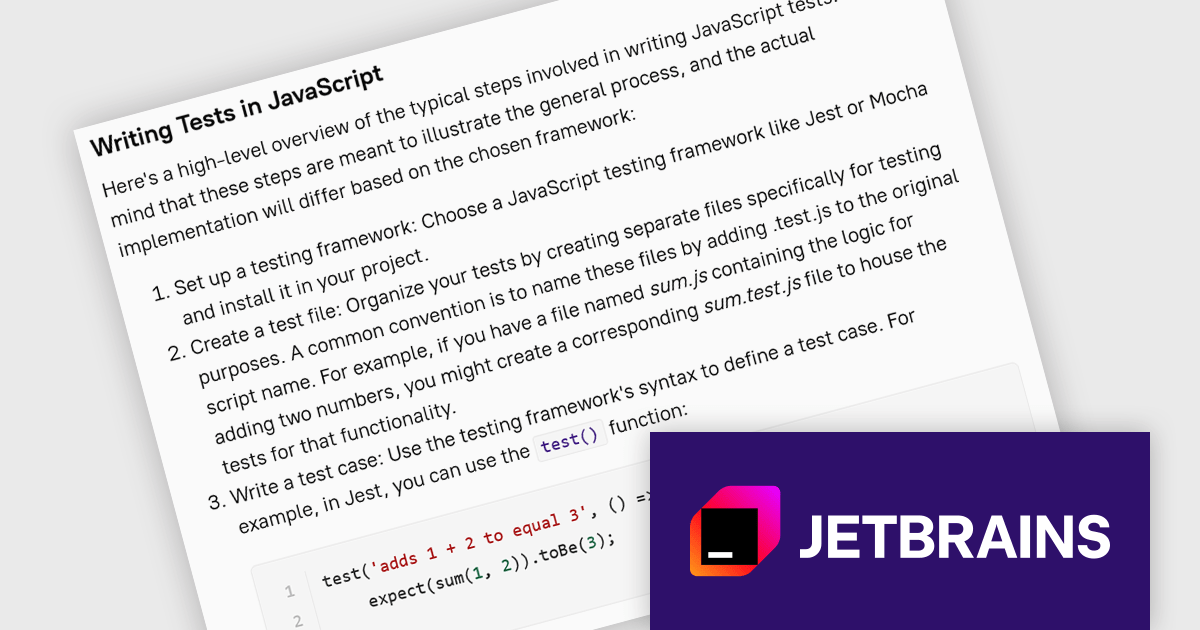
The JetBrains Academy July 2024 update expands its JavaScript curriculum with a brand new section dedicated to introducing testing frameworks. This course emphasizes the importance of testing in JavaScript development to ensure reliable code. It introduces key testing concepts including terminology and different testing types, and explores popular JavaScript testing frameworks, equipping you with the foundational knowledge to confidently write tests and improve your development workflow.
To see a full list of what's new, see our release notes.
JetBrains Academy is licensed per user as a commercial annual subscription. See our JetBrains Academy for Organizations licensing page for full details.
For more information, visit our JetBrains Academy for Organizations product page.
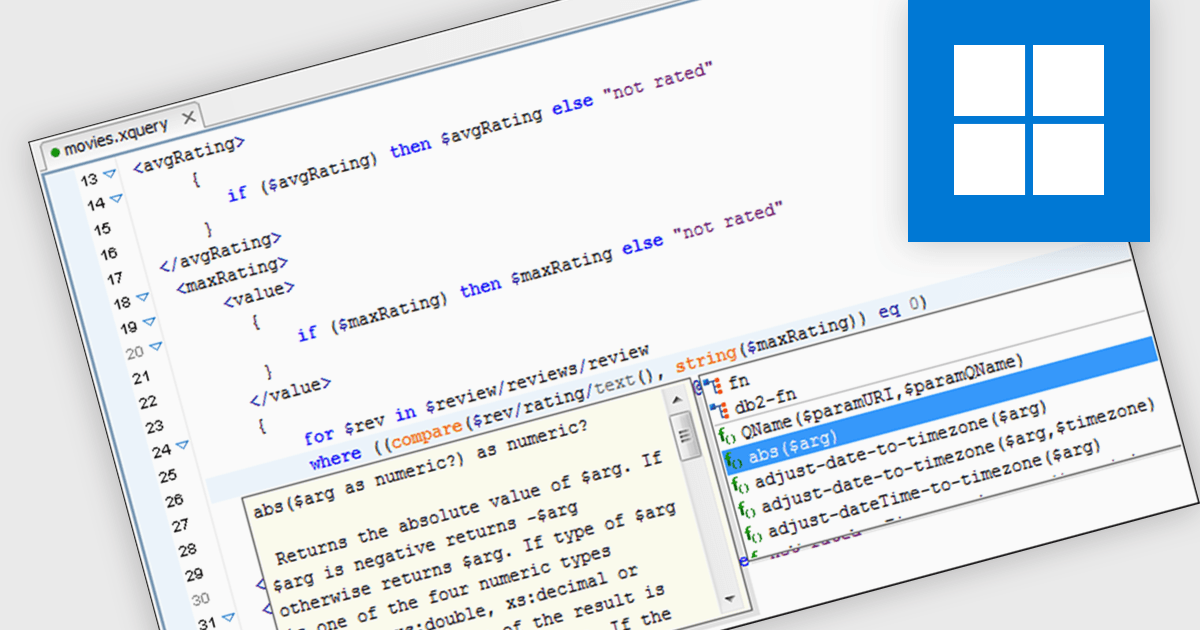
XQuery editors improve the development process for XQuery, a language for querying and manipulating XML data. These tools provide features like syntax highlighting, code completion, and context-sensitive help, boosting coding efficiency and accuracy. By offering integrated debugging and profiling functionalities, XQuery editors further enhance development workflows, allowing programmers to identify and rectify errors quickly.
Several structured document tools include an XQuery Editor, including:
For an in-depth analysis of features and price, visit our structured document tools comparison.
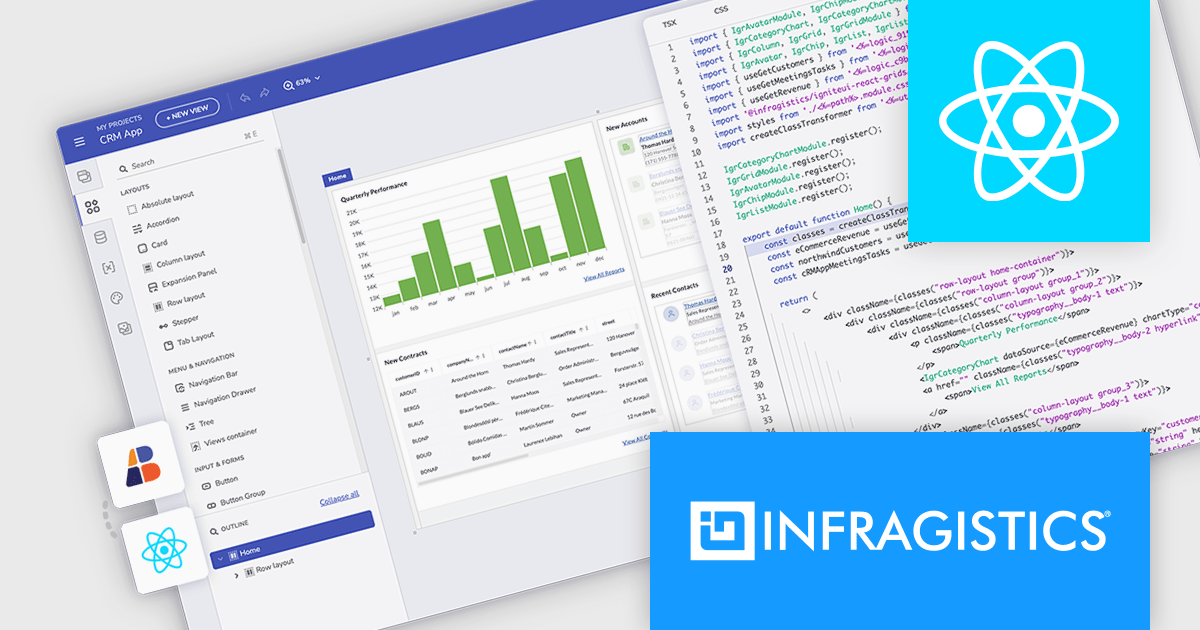
Infragistics App Builder is a cloud-based, WYSIWYG development tool that streamlines enterprise application creation through drag-and-drop functionality. Designed to accelerate development lifecycles, it empowers users to build business apps more quickly with features like pre-built templates, real-time code generation, and instant previews. This low-code approach is ideal for businesses seeking to improve development efficiency and shorten time-to-market for web applications.
The latest Infragistics App Builder release streamlines the workflow for React developers by enabling you to design and code your entire application within a single platform. This eliminates the need to switch between design tools and coding environments. You can effortlessly design your React app's UI with a familiar drag-and-drop interface, and App Builder will automatically generate clean, production-ready React code. This frees you to focus on core functionalities, letting Infragistics handle the UI design and code generation.
To see a full list of what's new, see our release notes.
Infragistics App Builder is licensed per developer as an annual subscription. See our Infragistics App Builder licensing page for full details.
For more information, visit our Infragistics App Builder product page.
전화 : 00798 14 800 6332
팩스 : +1 770 250 6199


