


공식 공급 업체
200 이상의 소프트웨어 개발처와 판매 계약을 맺은 공인 디스트리뷰터로서 합법적인 라이선스를 제공합니다.
모든 브랜드 보기.
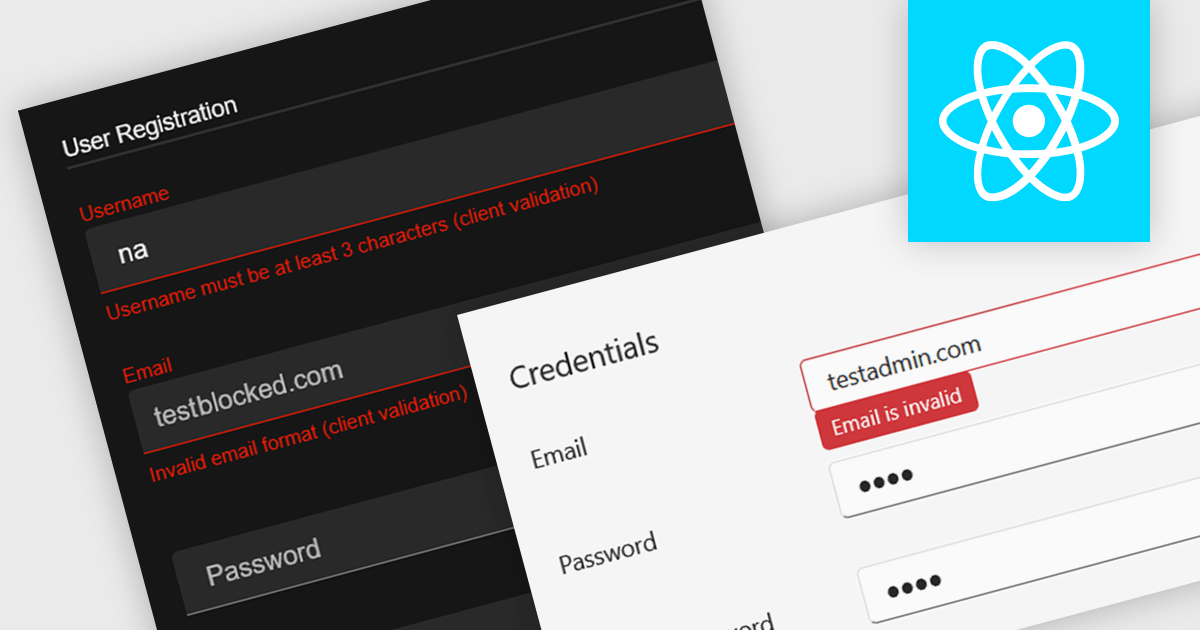
Data validation in a data editor component refers to the process of automatically checking user input against defined rules to ensure accuracy, consistency, and adherence to expected formats before the data is processed or stored. This can include checks for data types, required fields, value ranges, or pattern matching, typically enforced either on the client side for immediate feedback or on the server side for security and integrity. For software developers, incorporating data validation into a data editor improves data quality, reduces the risk of application errors, and enhances the user experience by guiding users to correct mistakes early in the input process.
Several React data editor collections provide support data validation, including:
For an in-depth analysis of features and price, visit our comparison of React data editors.
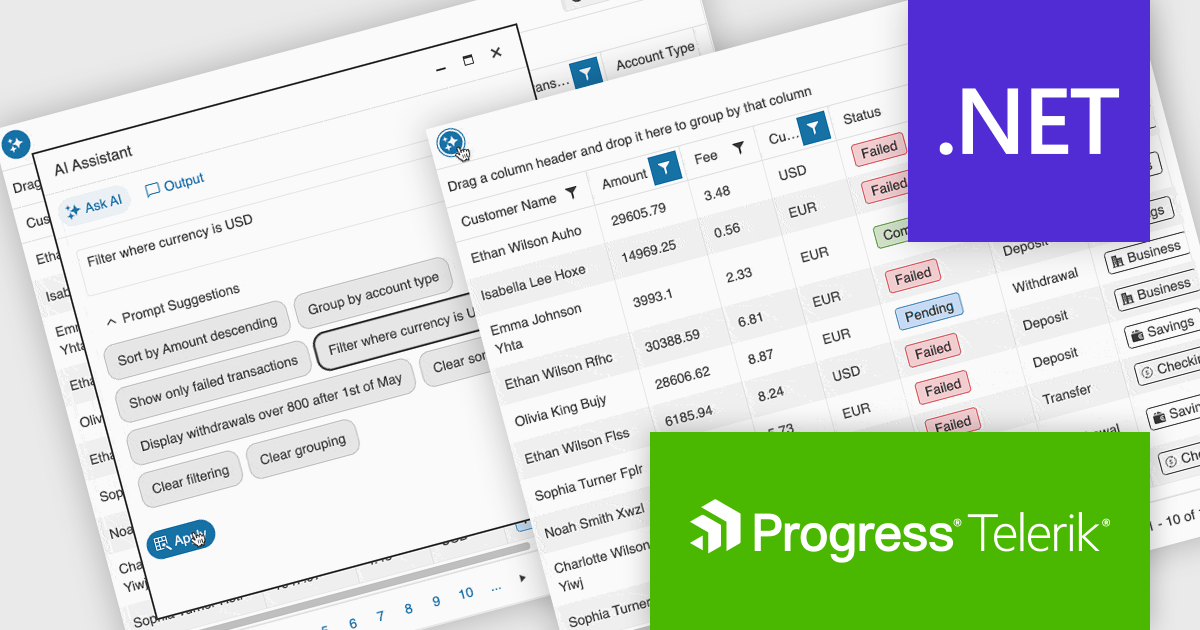
Telerik UI for ASP.NET Core, MVC, and Blazor are component libraries for building modern web apps with .NET. Each provides a rich set of customizable UI elements, like grids, charts, and forms, tailored to its respective framework, helping developers create responsive, interactive, and accessible user interfaces.
The latest update to the Telerik UI DataGrid introduces AI-driven controls that respond to natural-language prompts, making it easier for users to work with complex datasets. Users can now reorder, resize, and toggle column visibility just by describing what they want. Pagination, row selection, and data export to Excel, PDF, or CSV formats can also be handled through conversational input, reducing clicks and improving accessibility for both technical and non-technical users.
Telerik UI for ASP.NET Core, UI for MVC, and UI for Blazor are all licensed per developer and have two licensing models: an annual Subscription License and a Perpetual License. The Subscription License must be renewed to continue using the software. The Perpetual license is a one-time purchase granting access to the current released version and includes a one-year subscription for product updates and technical support. See our Telerik UI for ASP.NET Core, Telerik UI for ASP.NET MVC or Telerik UI for Blazor licensing pages for full details.
Telerik UI for ASP.NET Core, Telerik UI for ASP.NET MVC and Telerik UI for Blazor are available to buy individually or as part of the following products:

Chart zooming allows users to interactively adjust the visible range of a chart to focus on specific data points, time periods, or value ranges for closer analysis. By enabling users to zoom in and out dynamically, it reduces visual clutter, improves clarity, and helps uncover trends, anomalies, or patterns that may be difficult to identify at a full-scale view. This interactive capability supports faster, more informed decision-making by allowing movement between high-level overviews and detailed insights without reloading data. Common use cases include analyzing financial performance over specific timeframes, investigating spikes or drops in operational metrics, reviewing detailed sensor or monitoring data, and highlighting key data segments during presentations or stakeholder reviews.
Several JavaScript chart controls support zooming including:
For an in-depth analysis of features and price, visit our comparison of JavaScript Charts.
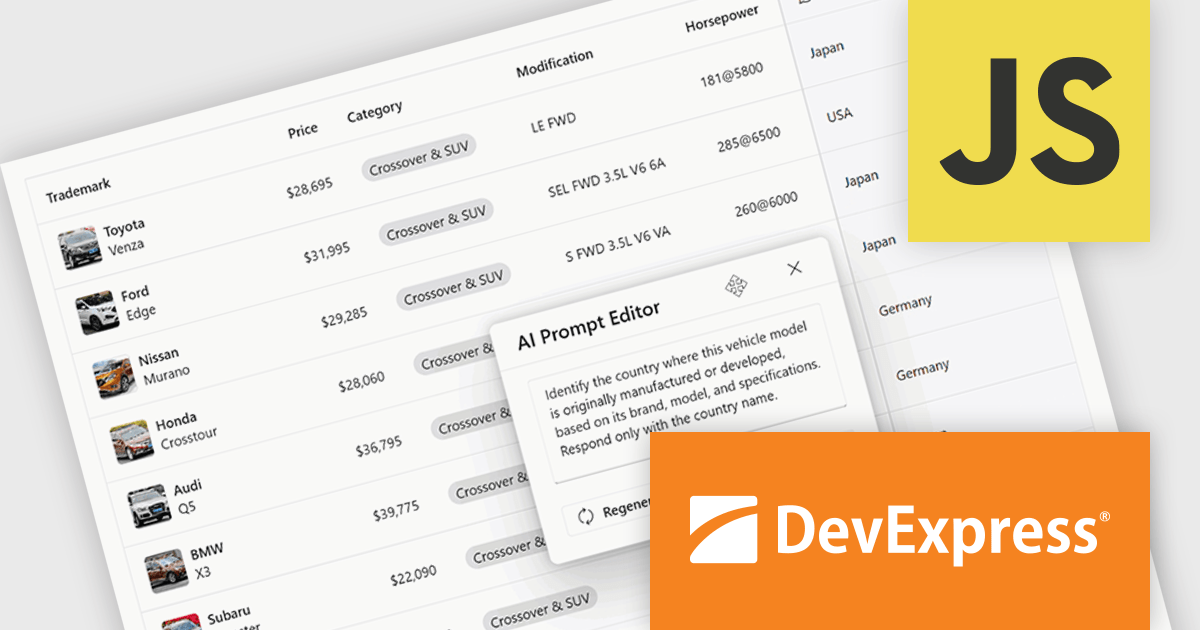
DevExtreme Complete is a robust suite of tools by DevExpress designed to streamline the development of high-performance web applications. It includes a wide range of UI components for modern frameworks such as Angular, React, Vue, and jQuery, making it ideal for developers aiming to create responsive, cross-platform applications with ease. With features like rich data visualization, interactive grids, form controls, and adaptive layouts, it empowers developers to deliver polished and user-friendly interfaces. Whether you're building enterprise dashboards or consumer-facing apps, DevExtreme Complete provides the flexibility and power to meet complex requirements while maintaining performance and usability.
The DevExtreme Complete 25.2 release brings AI Columns to its DataGrid and TreeList components, allowing developers to infuse artificial intelligence directly into their data presentation layers. AI Columns use component data and custom prompts to generate contextually relevant values - automating tasks like categorization, summarization, translation, and recommendation. Whether grouping records by priority, detecting sentiment, or transforming addresses, this feature opens up new ways to interact with and analyze structured data, making these components powerful tools for AI-assisted data exploration.
To see a full list of what's new in version 25.2, see our release notes.
DevExtreme Complete is licensed per developer and is available as a Perpetual License with a 12 month support and maintenance subscription. See our DevExtreme Complete licensing page for full details.
DevExtreme Complete is available to buy individually or as part of the following products:
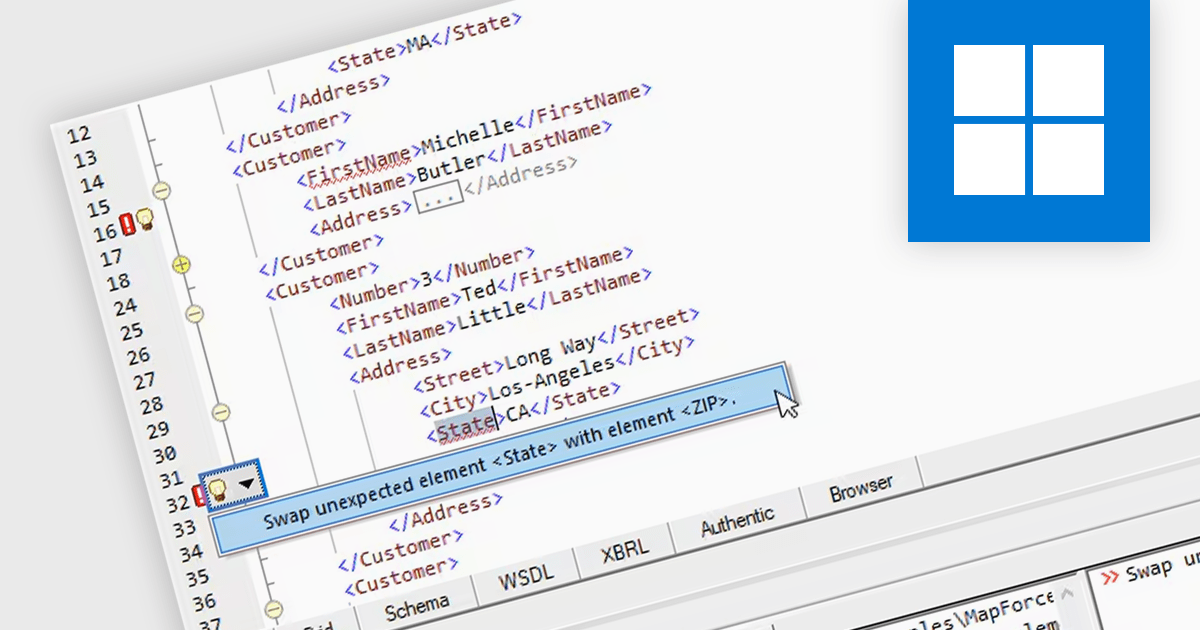
XML editing in structured document tools refers to the ability to create, modify, and manage XML (eXtensible Markup Language) content within an environment that enforces document structure and data integrity. These tools provide a schema-aware interface, often validating content against defined standards such as DTD (Document Type Definition) or XML Schema, to ensure that all elements and attributes follow a specified format. This structured approach reduces the risk of syntax errors and enhances consistency, making it easier to handle complex documents like technical manuals, legal texts, or scientific publications. Advanced features often include syntax highlighting, content assistance, and real-time validation, which help developers and content authors maintain high-quality structured data.
Several structured document tools offer XML editing including:
For an in-depth analysis of features and price, visit our comparison of structured document tools.
전화 : 00798 14 800 6332
팩스 : +1 770 250 6199


