


공식 공급 업체
200 이상의 소프트웨어 개발처와 판매 계약을 맺은 공인 디스트리뷰터로서 합법적인 라이선스를 제공합니다.
모든 브랜드 보기.
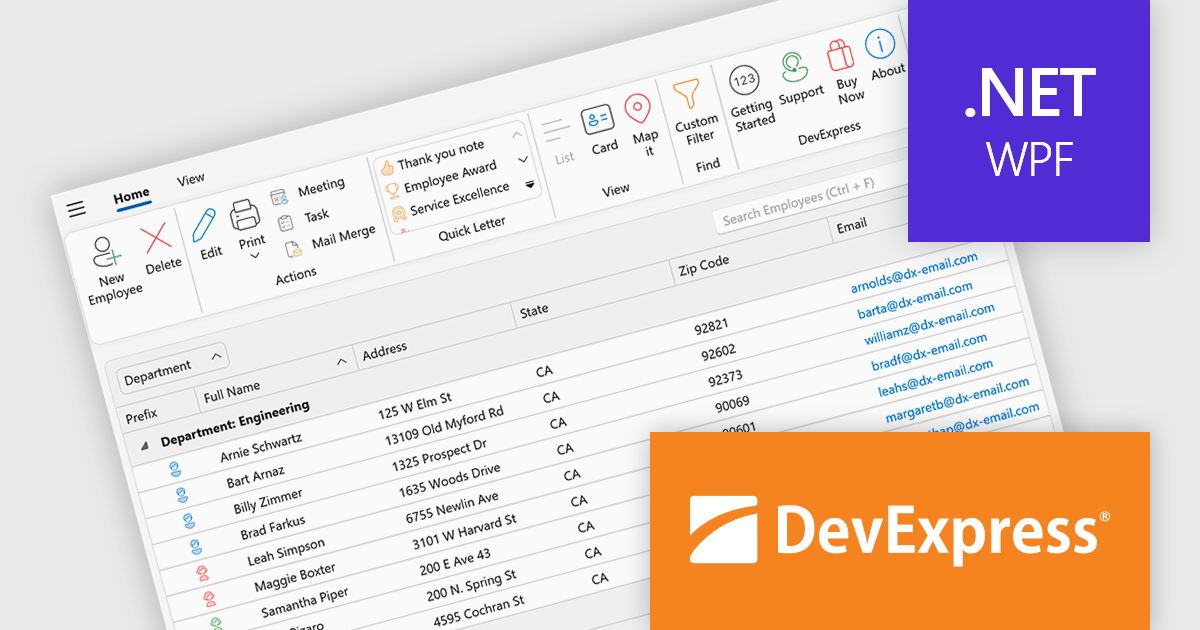
DevExpress WPF is a powerful suite of controls that enhances your WPF development toolkit. It offers data grids, ribbon menus, rich text editors, spreadsheets, charts, and more, all with beautiful themes and touch-friendly interfaces. DevExpress WPF helps you to build professional-looking, responsive applications that meet modern user expectations, saving you time and effort while adding polish and functionality.
The DevExpress WPF 25.2 update introduces support for a Page Header Button positioned directly in the ribbon’s page header area. This new UI element allows developers to replicate the toggle behavior seen in recent versions of Microsoft Outlook, where users can expand or collapse navigation panes with a single click. It is a simple yet effective way to enhance usability in complex applications, particularly those that rely on dynamic side panels or menus. This new functionality brings a modern and intuitive interaction model to WPF-based interfaces, aligning with common user expectations.
To see a full list of what's new in version 25.2, see our release notes.
DevExpress WPF is licensed per developer and is available as a Perpetual License with a 12 month support and maintenance subscription. We can supply new subscriptions, subscription renewals, and additional licenses. See our DevExpress WPF licensing page for full details.
DevExpress WPF is available to buy in the following products:
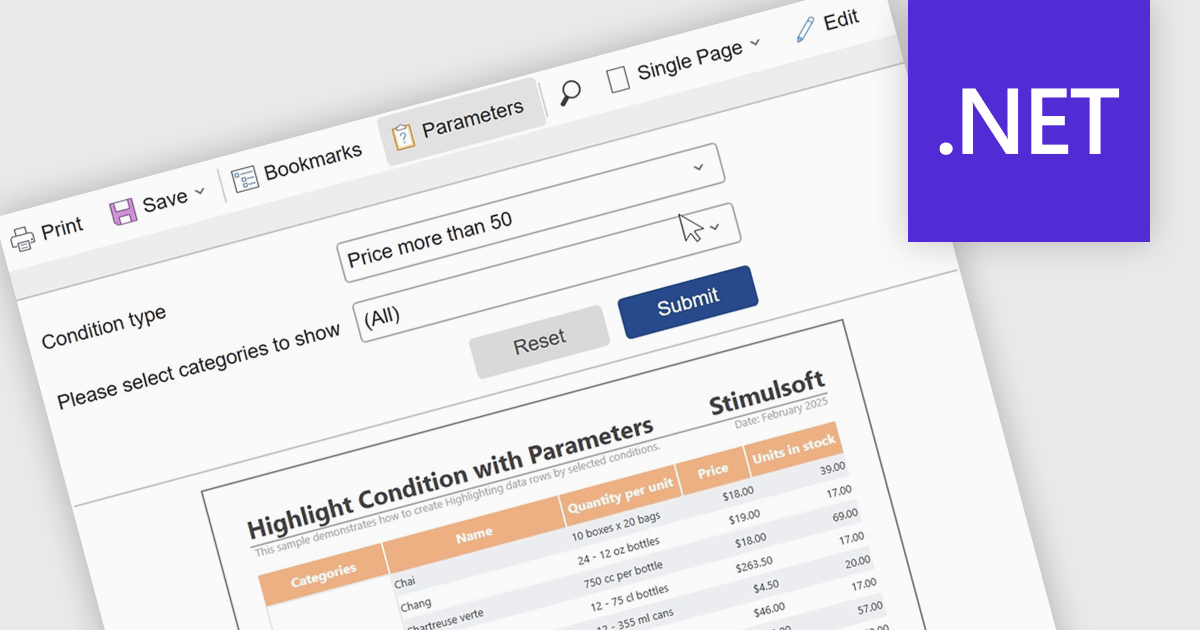
Report parameters allow users to customize and control how data is displayed by filtering results or supplying specific values at runtime. This enables more personalized, relevant reporting without the need to create multiple versions of the same report. By using parameters, organizations can improve data accuracy, improve report management, and help users to explore insights independently. Common use cases include filtering reports by date range, region, department, or product, setting thresholds or targets for performance analysis, and dynamically updating dashboards based on user-selected criteria.
Several .NET reporting components include support for parameters:
For an in-depth analysis of features and price, visit our comparison of .NET reporting controls.
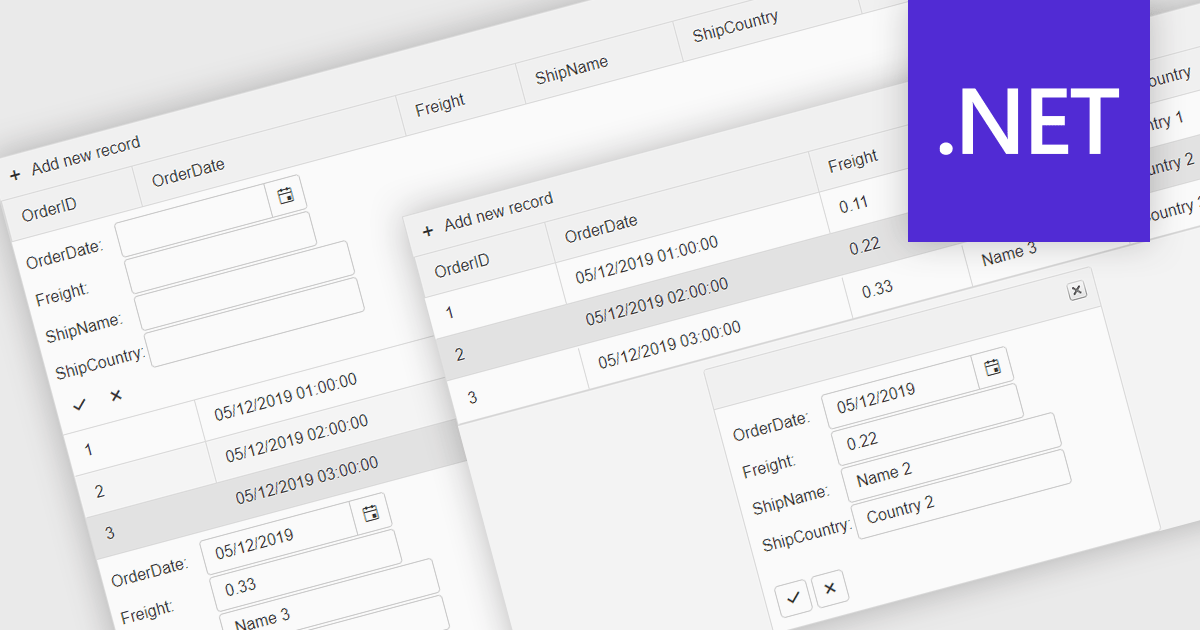
Forms in grids combine tabular data display with built-in form editing, allowing users to view and update records directly within the grid instead of switching to separate edit screens. This approach improves efficiency by keeping users in context, reducing navigation, and providing immediate validation and feedback. Forms in grids are commonly used in administrative dashboards, configuration screens, and data-heavy business applications where users need to edit multiple records quickly while maintaining visibility of related data.
Several .NET grid components enable form-based editing within grids, including:
For an in-depth analysis of features and price, visit our .NET grid controls comparison.
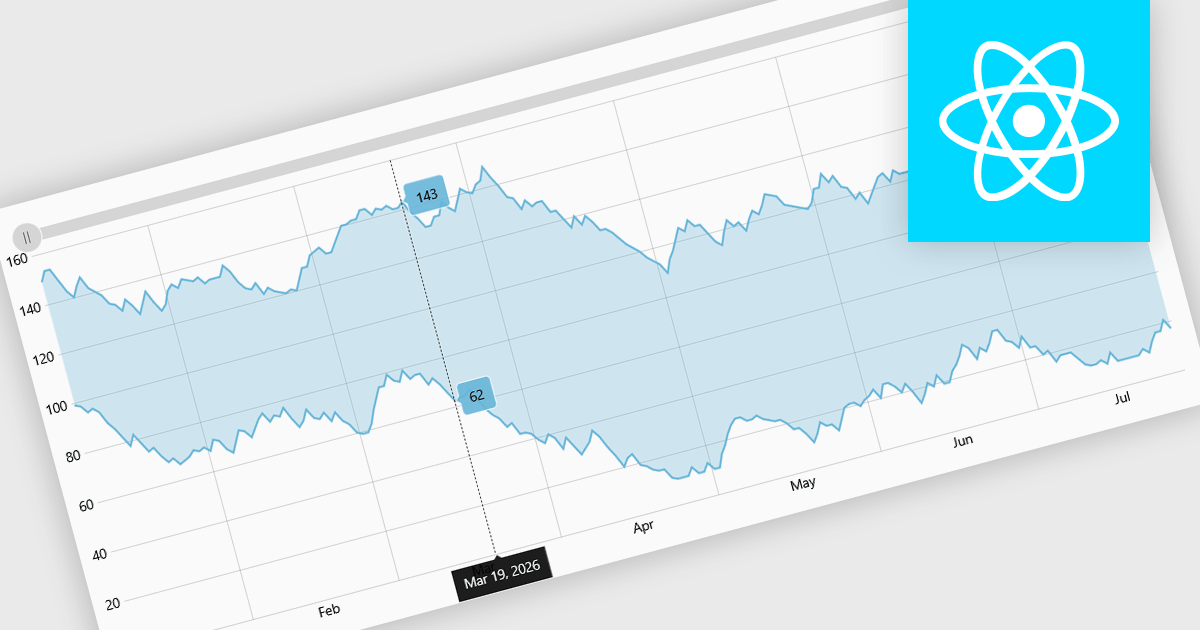
Range charts visualize financial data based on fixed price movements rather than time intervals, grouping activity into consistent ranges to highlight meaningful price action. By filtering out minor fluctuations and market noise, they make trends, volatility, support, and resistance levels easier to identify, especially in fast-moving or irregular markets. Common use cases include technical analysis for trading platforms, monitoring price volatility in equities or cryptocurrencies, and analyzing high-frequency financial data where understanding true market behavior is more important than tracking time-based changes.
Several React charting components provide you with range charts, including:
For an in-depth analysis of features and price, visit our React chart controls comparison.
Xceed PDF Library for .NET by Xceed Software is a developer-focused component that enables interaction with PDF documents directly within .NET applications. It provides a clean, intuitive API for creating, editing, and processing PDFs, allowing users to add, modify, or extract content such as text and images without relying on external tools or dependencies.
Designed for reliability and ease of integration, the library supports key features including digital signatures, document encryption, and permission controls to help secure sensitive information. These capabilities make it well suited for a wide range of use cases, from automating document generation and updating existing PDFs to applying security policies and extracting data for reporting or archiving. Ideal for both desktop and server-side applications, Xceed PDF Library for .NET helps teams improve PDF processes while maintaining control and consistency.
Xceed PDF Library for .NET is licensed per developer and is available as a perpetual license with 1 year of updates and support. See our Xceed PDF Library for .NET licensing page for full details.
For more information, visit our Xceed PDF Library for .NET product page.
전화 : 00798 14 800 6332
팩스 : +1 770 250 6199


